Curated OER
Inventors Unit Survey
Students develop and conduct a survey for their inventors unit. They create a five question survey and tally the survey results, and create a graph using Microsoft Word and Graph Club 2.0.
Curated OER
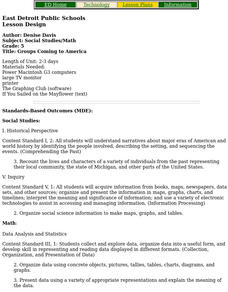
Groups Coming to America
Fifth graders use text or other references to locate different types of information about the Mayflower and pilgrims. They create a presentation for lower elementary classes about the Pilgrims.
Curated OER
Virtual Field Trip / Route, Mileage and Gasoline Cost Graphs
Pupils use a spreadsheet program to graph and compare milage, gasoline costs and travel time for two travel routes in their virtual field trip in Michigan. They determine the most economical route based on the graphs and calculations.
Curated OER
The Amazing Race
Seventh graders engage in a discussion to determine their experience with traveling. Ask them to describe differences in transportation, currency, culture, food, accommodation, etc. Then they discuss the different expenses one has when...
Curated OER
Tally Time
Learners create a tally chart. In this math and health instructional activity, students discuss healthy foods and create a tally chart showing the number of learners who like to eat healthy foods.
Curated OER
What on Earth is Greater Than?
Students compare things that are greater than, less than, or equal to, compare the Earth to other planets, and list planets from greatest size to smallest size.
Curated OER
Paper Planes
In this unit, 3rd graders investigate one variable to see if they can make a paper plane fly farther. They use scatter plots to establish a possible relationship between variables then use what they have found to make a paper plane to...
Curated OER
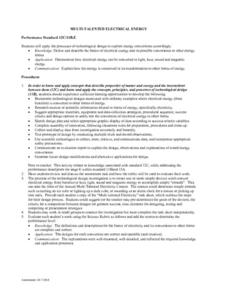
Multi-Talented Electrical Energy
Young scholars explore energy conversions by demonstrating the conversion of electrical energy into light, heat, sound, and magnetic energy. Students create a simple device that converts electrical energy from batteries to heat, light,...
Curated OER
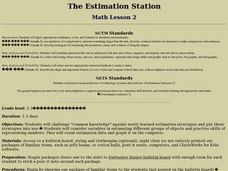
The Estimation Station
Students challenge "common knowledge" against newly learned estimation strategies and put those strategies into use. They consider variables in estimating different groups of objects and practice skills of representing numbers.
Curated OER
The Fuelish Fact Finding
Students define fluctuation and the price of food. In this algebra lesson, students create a budget to live on based on their living expenses. They create a chart and explore the cause and effect of real life scenarios.
Curated OER
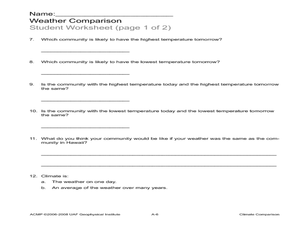
Climate Comparison
Students explore climate regions. In this climate lesson, students examine the climate regions of Alaska as well as the state of Hawaii. Students research selected Internet sources to gather information regarding the climates present in...
Curated OER
Mathematical Magazines
Students classify and tabulate the type of advertisements found in a collection of magazines. Determination is made on what percent of the total number of ads each type represents. They present their results orally and in a graph.
Curated OER
Cafeteria Mayhem
Students design a cafeteria floor plan. For this area and perimeter lesson, groups create an efficient lunchroom layout on poster board by using geometric shapes and formulas as the basis for their designs. In the accompanying writing...
Curated OER
Sled Kites and Trigonometry
Students study the history of kites and their fundamental properties. In this kites lesson students divide into teams and build and fly kites.
Curated OER
Mathematical Magazines
Students look through magazines and calculate the percentages of the types of ads in the magazines. In this percentages lesson plan, students create a graph to show their results.
Curated OER
Keeping a Daily Weather Log
Students create their own daily log books for recording and keeping track of the weather.
Curated OER
Chemical Weathering
Students measure the effect of water temperature on the rate of a chemical reaction, similar to the interaction of a weak acid and carbonate rock, using hot water and effervescent antacid tablets.
Curated OER
C is for Cookie-A MEAN-ingful Graphing Activity
Third graders, in groups, dissect a variety of brands of chocolate chip cookies and calculate the mean for each brand. They create their own bar graphs, pictographs, and line graphs to represent information.
Curated OER
Statistics: Misleading or Accurate?
Students explore the concept of misleading statistics. In this misleading statistics lesson plan, students play a game of tag and graph the number of times each student gets tagged. Students use the graph to determine the fastest...
Curated OER
Fire!, Probability, and Chaos
Students explore the concept of probability. In this probability lesson, students simulate a controlled forest burn using an applet. Students vary the probability of trees burning and predict what will happen.
Curated OER
The Price Is Right
Students create a list of products with estimated prices. In this algebra instructional activity, students learn to write equations using variables. They match their created list with that of actual products and compare their...
Curated OER
Box And Whiskers
Students investigate the concept of using box and whisker plots. They demonstrate how to use them to compute median, mode, and range. Students compare and contrast the complete and systematic processes use to solve problems. This is done...
Curated OER
Probability and Sports
Students research topics on the internet where probability is relevant. Students study statistics and probability concepts by looking at practical questions that arise in professional sports.

