Curated OER
Math on the Ragbrai-Using the Proper Tools to Solve Problems
In this problem solving tools activity, students complete a set of 10 multiple choice questions. Worksheet is labeled as a "pre test."
Curated OER
Russian Dolls Investigation
Students measure a set of Russian dolls using the metric system. In this measurement lesson plan, students identify certain relationships between sets of measurements by measuring a set of Russian dolls and presenting their findings to...
Curated OER
The Most Important Equation in Astronomy!
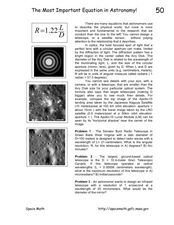
For this astronomy optics worksheet, students calculate the angular resolution and maximum resolution for given telescope specifics. This worksheet has 3 problems to solve.
Curated OER
Geometry Journal: Classifying Solids
In this geometry worksheet, 10th graders respond to journal prompts related to prisms and classifying solid shapes. The two page worksheet contains nine questions. Answers are included.
Curated OER
What's Your Line?
Fifth graders collect temperature readings over a period of time, enter the information into a spreadsheet and choose the appropriate graph to display the results.
Curated OER
Saving Money Through Mathematics
Third graders discuss light sources and collect data about energy sources. They compare data and create a multiple line graph showing energy used by light sources for each student in the group. They present their graphs and write a...
Curated OER
Optional Laboratory: Calculating Board Footage in a Tree
Middle schoolers work together to complete an experiment calculating the amount of board footage in a tree. They record their data and answer questions at the end of the lesson. They create their own hypothesis as well.
Curated OER
Pi Digit Distribution
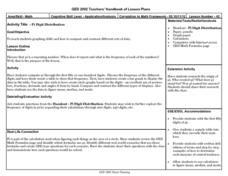
Learners study graphing skills and compare and contrast data sets. They compute pi through the first 50-100 digits and create a bar graph showing the frequencies of specific digits.
Curated OER
How Long is a Slinky?
Students take part in a variety of measurement tasks. Students measure the length of a slinky. Students work out how many slices of tomato will fit around the edge of a pizza. Students measure the label from a can accurately.


