Hi, what do you want to do?
Math Slice
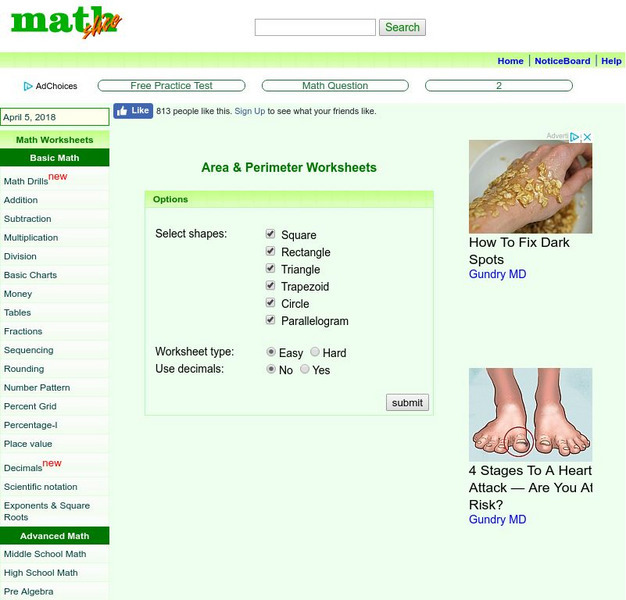
Math Slice: Area & Perimeter: Math Worksheets
This tool allows you to create worksheets of word problems at varying levels of difficulty where students must calculate the area or perimeter of different polygon shapes. You can choose to set up the page using any of these polygon...
Texas Instruments
Texas Instruments: Numb3 Rs: Meltdown
Based off of the hit television show NUMB3RS, this lesson has students explore the relationship between a circle's area and it's radius. This is framed in the context of a scene in where a pile of ice is melting into an increasingly...
ClassFlow
Class Flow: Goats and Monsters
[Free Registration/Login Required] Students explore methods to measure lengths of squares and radius of a circle in trying to keep a goat from escaping.
Annenberg Foundation
Annenberg Learner: Math in Daily Life: Home Decorating
This exhibit is designed to show students that geometry really does apply to the real world. By taking viewers through a home decoration project, students learn how to calculate area of a rectangle and circle.
BBC
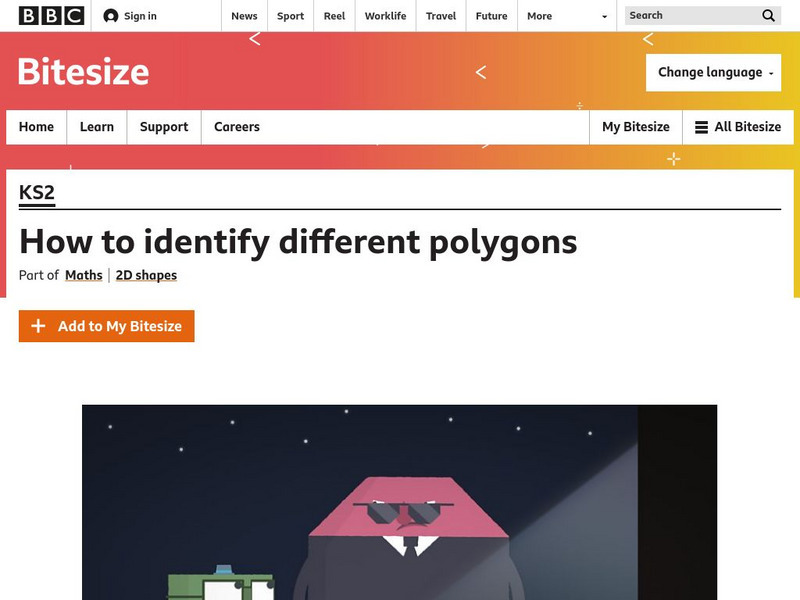
Bbc: Bitesize: Maths: 2 D Shapes
Learn about the properties of 2-D shapes: circles, triangles, polygons, and quadrilaterals. Includes information, video, and examples about each, with games and quizzes for reinforcement.
Alabama Learning Exchange
Alex: Geometric Quilts
Students will use a square to investigate other polygonal shapes that can be formed. Students will work with these polygons to make designs that will later constitute cooperatively designed quilts. The quilts will be made by translating,...
Curated OER
Etc: Maps Etc: United States Population Density, 1850
A map from 1912 of the United States, subtitled "Distribution of Population and Railways in 1850." The map is color-coded to show population densities ranging from areas with fewer than 2 inhabitants per square mile to areas of 90 or...
Curated OER
Educational Technology Clearinghouse: Maps Etc: Population Density, 1910
A map of the United States showing the distribution of the population in 1910. The map is keyed to show areas of population with densities ranging from under 2 inhabitants per square mile to 90 and over inhabitants per square mile. The...
Curated OER
Etc: Maps Etc: United States Population Density, 1900
A map from 1912 of the United States, subtitled "Distribution of Population and Railways in 1900" showing the increase in population and expansion of the railroad network since 1850. The map is color-coded to show population densities...
Calculator Soup
Calculator Soup: Volume Calculator
Use this online calculator to calculate the volume of geometric solids including a capsule, cone, frustum, cube, cylinder, hemisphere, pyramid, rectangular prism, sphere, and spherical cap.
Curated OER
Unesco: Indonesia: Borobudur Temple Compounds
This famous Buddhist temple, dating from the 8th and 9th centuries, is located in central Java. It was built in three tiers: a pyramidal base with five concentric square terraces, the trunk of a cone with three circular platforms and, at...


