Curated OER
Stem-and- Leaf Plots
Students are introduce to the notion of stem-and-leaf plots. They use stem-and-leaf plots to calculate the mean, median, and mode of a set of data. Students use computers to learn about stem-and-leaf plots.
Curated OER
The Bell Curve
Learners are introduced to the concepts of the normal curve, skewness and the standard deviation. They discuss how the normal distribution has been used and misused to support conclusions.
EngageNY
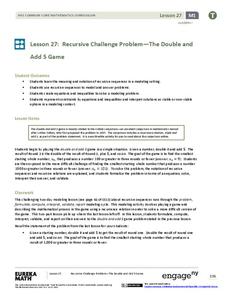
Recursive Challenge Problem—The Double and Add 5 Game
As a continuation of a previous lesson, this activity builds on the concept of calculating the terms of a sequence. Pupils are challenged to determine the smallest starting term to reach a set number by a set number of rounds. Notation...
Curated OER
Arithmetic Complex Numbers
Students convert quadratic functions from standard form to vertex form. In this algebra lesson, students solve polynomials using synthetic and long division. They derive and apply the remainder theorem and factor theorem.
Curated OER
Arithmetic Patterns
Introduce your young math scholars to functions. Because the answer is explained at the bottom of the page, consider projecting this and covering it up until you hear the class responses. They observe a rule (in this case to add 15) and...
CK-12 Foundation
Coefficient of Variation: Diverse Populations
What is the height of school clubs? Learners use sliders to calculate the coefficient of variation for three different school groups. Using the calculations, class members compare the variation in the heights of the groups.
Curated OER
Slopes, Hopes, & Speed
Students investigate the sport of skiing through Internet research in this multi-task lesson. They compare and generalize the results of five individuals by using mean, median, and mode.
EngageNY
An Appearance of Complex Numbers 1
Complex solutions are not always simple to find. In the fourth lesson of the unit, the class extends their understanding of complex numbers in order to solve and check the solutions to a rational equation presented in the first lesson....
Teacher Created Resources
How to Calculate Discounts and Sales
Teach discounts and sales with a straightforward worksheet. After reviewing the concept, pupils solve word problems related to dollars and percentages. The second half of the sheet prompts learners to continue solving problems related to...
Curated OER
The Power of Graphical Display: How to Use Graphs to Justify a Position, Prove a Point, or Mislead the Viewer
Analyze different types of graphs with learners. They conduct a survey and determine the mean, median and mode. They then identify different techniques for collecting data.
EngageNY
Vectors in the Coordinate Plane
Examine the meaning and purpose of vectors. Use the lesson to teach your classes how find the magnitude of a vector and what it represents graphically. Your pupils will also combine vectors to find a resultant vector and interpret its...
Illustrative Mathematics
The Stamp Collection
By using language like "half of the stamps," children are exposed to patterns in arithmetic that requires solving a two-step word problem. This type of language opens a new door for transitioning learners toward understanding fractions...
Armory Center for the Arts
Place Value Collage
How can art represent math? Use a lesson on place value collages to illustrate the different meanings that numbers have in their designated places. Kids observe photographs and paintings that show place value, then work on their own.
Curated OER
Stem-and-Leaf Plots
Young scholars are introduced to stem-and-leaf plots and calculating the mean, median, and mode from the plots.
Curated OER
Practicing Arithmetic
Students practice single operation arithmetic ranging from single digit addition to long division of decimals or real numbers using Graphit. They use data sets and rules to graph ordered pairs.
Curated OER
An Introduction to Elementary Statistics
Students explain and appreciate the use of statistics in everyday life. They define basic terms used in statistics and compute simple measures of central tendency.
Curated OER
Statistics of Mars
Students explore the concept of central tendencies. In this central tendencies lesson, students sort M&M's or Skittles based on color. Students graph their results. Students find the mean, median, and mode of their data.
Curated OER
Application and Modeling of Standard Deviation
The first activity in this resource has learners computing the mean and standard deviation of two different data sets and drawing conclusions based on their results. The second activity has them using a dice-rolling simulation to...
Curated OER
Secret Messages and Matrices
Students use matrices and linear equations to decrypt a secret message. They receive a part of the encoded message to decode by means of inverse matrices. Pupils write critiques about the activity.
Curated OER
Addition - Sums to 9 (3 of 3)
Simple summation skills are the meat and potatoes of future arithmetic skills. Use this worksheet to provide practice for your first graders when adding single digits. Answers are provided by the click of a box at the top of the page,...
Curated OER
Business & Statistics: Final Exam
In this business and statistics worksheet, students read real-life business problems, arrange data, and identify the probability method best used to determine the answer. They identify the type of random sample, draw stem-and-leaf plots,...
Curated OER
SAT Grid Ins Practice Test 09
In this SAT practice worksheet, high schoolers solve 10 grid in problems. Students find surface area, slope, mean, factors, etc.
Curated OER
Introduction to Arithmetic and Geometric Sequences
Pupils examine the concept of sequences. Students create a sequence using varied starting numbers, multipliers, and add on values. Pupils practice determining the starting values to use in order to produce a desired sequence.
Curated OER
Modular Arithmetic Station
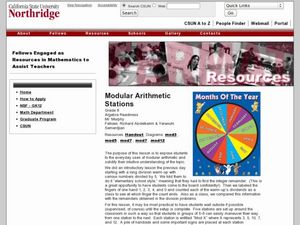
Eighth graders find ways to use math everyday. In this algebra lesson, 8th graders model equation and problem solving as they multiply and divide numbers. They split up in to groups as they perform hands on operations.


