Curated OER
Graphs
In this Cartesian coordinate plane worksheet, students analyze 4 ordered pairs and locate the place that goes with that point on a graph. Students also write the ordered pair for 4 places shown on the graph. Note: One of the places is a...
Curated OER
Plotting Temperature and Altitude
students convert the temperature readings from degrees Celsius to degrees Fahrenheit. they predict and create a graph of what the graph of altitude (x-axis) versus temperature in degrees Fahrenheit (y-axis) might look like.
Curated OER
The Next Dimension
Students explore the three dimensional Cartesian coordinate system and discuss how it is important for structural engineers in order to be able to describe locations in space to fellow engineers. They participate in a hands-on activity...
Curated OER
Usage and Interpretation of Graphs
Students review graphing and use processing skills to solve problems.
Curated OER
Graph it!
Sixth graders view a Stacked Graph, and discuss what it shows. Students discuss the basics of graphing: labels, intervals, legends x and y axis... Students create individual stacked graphs from provided information. Students view a...
Curated OER
Introducing Powers and Models
Students construct two dimensional models to illustrate squared numbers. For this geometry lesson, students use graph paper and an x/y axis to build squares exponentially. Students identify powers and relationships between various...
Curated OER
Reflections
In this geometry worksheet, students identify the different types of reflections across the x and y axis. There are 6 questions on this worksheet with an answer key.
Curated OER
Delta-Epsilon Definition of a Limit
Twelfth graders define limits and use the delta epsilon definition to solve limits. In this calculus instructional activity, 12th graders investigate the x and y axis using delta epsilon limits. They learn a song to help them remember...
Curated OER
Volumes Disks and Shells
In this calculus worksheet, learners calculate the volume using the Disk and Shell method. There are 6 problems asking for the rotation around the x and y axis.
Curated OER
Forms of Equations
Ninth graders discuss the different forms of equations. In this algebra lesson, 9th graders talk about the pros and cons of algebraic equations. They discuss reflection across the x and y axis and write out the equation of the given...
Curated OER
Boots
In this graphing practice instructional activity, 5th graders plot squares on a graph with an x and y axis. Once students locate each square they must color a certain design in that box to create a larger picture.
Curated OER
Graphs to Represent a Data Set
Here are the number of animals Jackson saw at the zoo; scholars organize data into bar graphs using this instructional activity. Encourage labeling, but consider having scholars do these on another sheet because there isn't room for the...
Curated OER
Ordered Pairs
In this ordered pairs worksheet, 10th graders solve and graph 6 different sets of points on each graph. First, they draw each of the given ordered pairs in each problem on the gird shown. Then, students label each of these points on the...
Curated OER
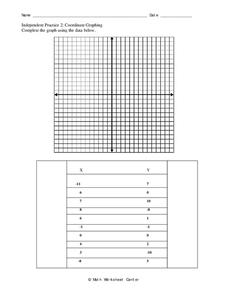
Coordinate Graphing
In this coordinate graph worksheet, 10th graders graph and complete 10 pairs of numbers on the illustrated gird. They graph each x point and label it on the graph. Then, students graph each y point listed on the graph and label those...
Curated OER
Equations and Inequalities
In this equations and inequalities worksheet, 9th graders solve and complete 2 multiple choice problems. First, they read and identify the graph shown representing a given equation. Then, students determine the graph that best represents...
Curated OER
Grasping Graphs
In this grasping graphs worksheet, students solve and complete 3 different types of problems. First, they graph the data described and select the appropriate graph type. Then, students identify the independent and dependent variable. In...
Curated OER
Calculus Review
In this calculus worksheet, students figure out the volume of an area under the curve rotated about the x and y axis. There are 2 questions on this worksheet with various sub-section.
Curated OER
Graphing on a Coordinate Plane
Eighth graders explore the coordinate system. They identify the x and y-axis, parts of the coordinate plane, and discuss the process of plotting points. To emphasize the process of plotting points, 8th graders play an ordered pair...
Curated OER
Play Dough Day
Twelfth graders build a model of the following figures with the base from column I and the cross-section from column II. Draw the base with labeled axes on the graph paper and construct the figure on top of the base with the play dough...
Curated OER
Reflections of a Linear Function
Students reflect functions about the X-axis, Y-axis, and origin. They derive equations for reflected functions using the website www.explorelearning.com.
Curated OER
Got Complements? with Cabri Jr.
Learners use the axes and measure angle tool to explore and calculate complementary angles with Cabri Jr. They also identify what happens to the calculation as they drag the endpoint into a different quadrant. Finally, they label each...
Curated OER
Worksheet 27 - Fall 1995
In this math worksheet, students find the area bounded by the tangent line, the x-axis, and the line x =2. They also describe the graph of the function.
Curated OER
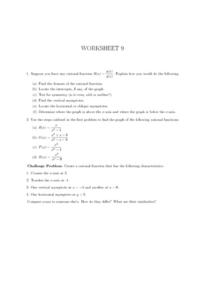
Worksheet 9, Rational Functions
In this algebra worksheet, learners tell how they would find the domain of a rational function. They find the intercepts of a rational function and graph it. Students test for symmetry, locate the asymptotes and determine where the graph...
Curated OER
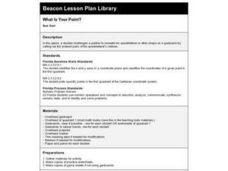
What Is Your Point?
Sixth graders identify the x and y axes in a coordinate plane and identifies the coordinates of a given point in the first quadrant. They plot specific points in the first quadrant of the Cartesian coordinate system.
Other popular searches
- X and Y Axis
- X Y Axis
- Reflection X Axis
- X and Y Axes
- Dependent Axes
- Axis (Axes
- Axes 0
- Stone Axes
- Graphing X Y Axis
- Independent Axes
- Reflection Across X Axis
- Horizontal and Vertical Axes


