Activity
University of Vienna (Austria)

The Graphs of Sin, Cos, and Tan Maths Online

For Students 9th - 10th
This applet allows the user to create the graphs of sin, cos, and tan by moving a scroll bar. The user can watch the unit circle and the graph simultaneously to see how the two are related. The user may also choose to see the angle...
Activity
University of Regina (Canada)

University of Regina: Math Central: Circle and Bar Graphs

For Students 9th - 10th Standards
Students evaluate data, use the data to make different types of graphs, and then investigate these graphs. Teacher's notes are included along with downloadable versions of the activity. This lesson is from a group of lessons that uses...
Lesson Plan
University of Texas at Austin

Mathematics Teks Toolkit: And We Go Around

For Teachers 3rd - 8th Standards
Collect and display data using a bar and circle graph to explore fractions and percents.
Unit Plan
PBS

Pbs: The Lowdown: Exploring Changing Obesity Rates Through Ratios and Graphs

For Students 6th - 8th
In these KQED Lowdown infographics, explore how adult obesity rates in the United States, as measured by body mass index (BMI), have dramatically changed in the past half-century. A circular graph and a pictograph depict data by decade,...
Whiteboard
ClassFlow

Class Flow: Types of Graphs

For Teachers 9th - 10th Standards
[Free Registration/Login Required] This flipchart explores the use of graphs. Bar graphs, tables and circle graphs are discussed.
Unknown Type
Government of Alberta

Learn Alberta: Math Interactives: Exploring Election Data

For Students 6th - 8th
Using actual Alberta provincial election results, students have the opportunity to interpret election data using a variety of graph types. Pictographs, line graphs, bar graphs, circle graphs, and data tables are covered in this...
Unit Plan
Beacon Learning Center

Beacon Learning Center: All That Data

For Students 3rd - 8th Standards
Students analyze data by finding the mean, median, mode, and range of a set of numbers. Line plots, bar graphs, and circle graphs are also included in this lesson.
Interactive
Physics Classroom

The Physics Classroom: Circular and Satellite Motion: Roller Coaster Model

For Students 9th - 10th
An interactive playground for students to explore the physics of roller coasters. Learners investigate by changing the variables of force, velocity, friction, and vectors. Energy bar charts are displayed as the coaster car moves along...
Activity
The Math League

The Math League: Using Data and Statistics: Pie Charts

For Students 3rd - 8th Standards
This introductory tutorial about statistical graphing with four examples of how pie charts (circle graphs) are constructed and read.
Whiteboard
ClassFlow

Class Flow: Graphs

For Teachers 3rd - 5th Standards
[Free Registration/Login Required] This flipchart presents bar and double bar graphs, line and double line graphs, pictographs, histograms, and circle graphs with review activities and web links for practice.
Whiteboard
ClassFlow

Class Flow: Graphing

For Teachers 3rd - 5th Standards
[Free Registration/Login Required] Students will identify pictographs, bar graphs and circle graphs.
Activity
Texas Education Agency

Texas Gateway: Analyze Graphical Sources: Practice 2 (English I Reading)

For Students 9th - 10th Standards
You will look at each of these types of graphs: bar graph, line graph, pie charts, as you work your way through the lesson.
Unit Plan
Texas Education Agency

Texas Gateway: Selecting and Using Representations for Collected Data

For Students 5th - 7th
[Accessible by TX Educators. Free Registration/Login Required] Given a variety of data (including line plots, line graphs, stem and leaf plots, circle graphs, bar graphs, box and whisker plots, histograms, and Venn diagrams), the student...
Lesson Plan
Alabama Learning Exchange

Alex: Get on Your Mark, Get Set, Go!

For Teachers 6th - 8th Standards
In collaborative/cooperative groups, students will review basic vocabulary and concepts for data and statistics. Students will create, collect, display, and interpret data in the form of frequency tables, bar graphs and circle graphs.
Unit Plan
E-learning for Kids

E Learning for Kids: Math: Treasure Island: Interpreting Data

For Students 5th - 6th
Students will play interactive games to interpret information from different types of graphs.
Lesson Plan
PBS

Pbs: Mathline Creature Feature Lesson Plan [Pdf]

For Teachers 3rd - 5th
An interdisciplinary math, science, and language arts lesson plan that engages students in an exploration of statistics. Through a study of various forest climates, students utilize data collection and analysis, classification, and...
Activity
Shodor Education Foundation

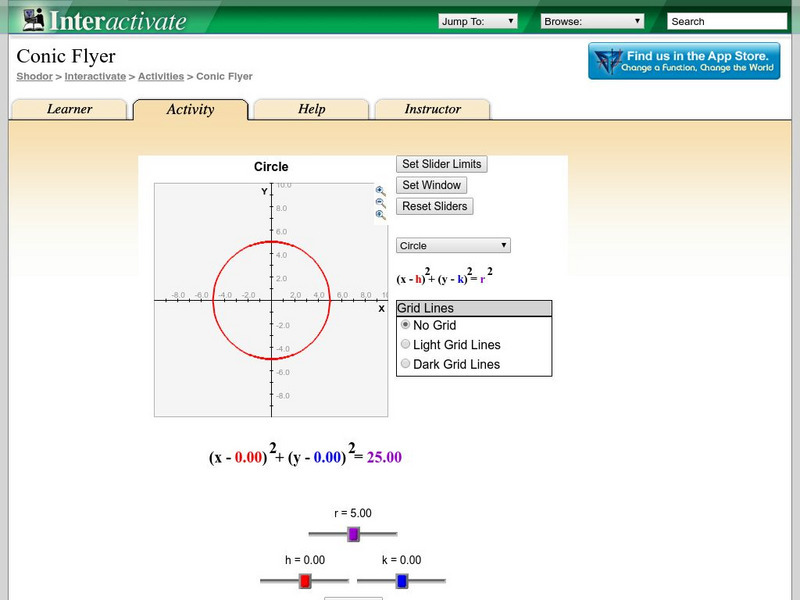
Shodor Interactivate: Conic Flyer

For Students 9th - 10th
"This applet allows the user to create graphs of conic sections. Using slider bars, one can manipulate the function to change the constant values and view the effects of those changes."
Unknown Type
That Quiz

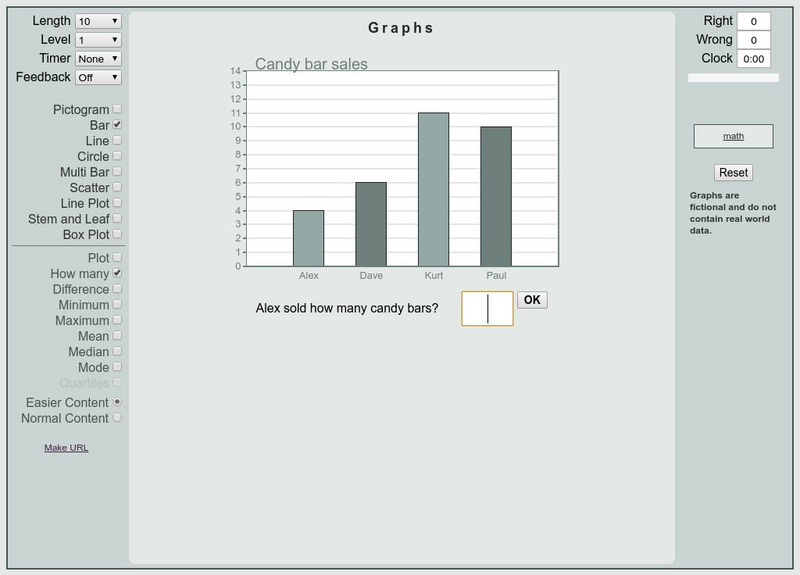
That Quiz: Graficas

For Students 9th - 10th Standards
This is an interactive practice to review bar graphs, circle graph, scatter plot, etc. Test are timed and keep track of right and wrong answers. Different levels of difficulties are provided.
Activity
Rice University

Rice University: The Hand Squeeze

For Teachers 9th - 10th
Students will enjoy this data collection and class analysis experiment involving the time it takes for a hand squeeze to travel around a circle of people. From organizing the activity to collecting the data to making a table and graphing...
Lesson Plan
PBS

Pbs Kids Afterschool Adventure!: Operation: Data Saves the Day Activity Plan

For Teachers 1st - 3rd Standards
Data comes to the rescue! Children will collect, analyze, and represent data as they try to dodge a series of catastrophes faced by characters from their favorite PBS Kids shows.
eBook
Physics Classroom

The Physics Classroom: Energy Relationships for Satellites

For Students 9th - 10th
The orbits of satellites are described and an energy analysis is performed. Kinetic, potential and total mechanical energy are explained and applied to the motion of satellites.

Other popular searches