Curated OER
Problem Solving: Use a Graph: Problem Solving
In this bar graph activity, students read the word problem and use the bar graph to complete the problem solving questions for understand, plan, solve, and look back.
Curated OER
Data Handling: Bar Chart Showing Frequency
In this bar graph worksheet, students analyze a bar graph showing soccer goals scored. Students then use the data to solve 7 problems.
Curated OER
Cutting Expenses
Learners explore budgeting. In this finance and math instructional activity, students brainstorm ways in which households could save money. Learners view websites that give cost reducing ideas. Students complete an expense comparison...
Curated OER
Use a Bar Graph: Practice
In this bar graph worksheet, students use data in a bar graph to solve 2 word problems, 2 mental math problems and 1 multi-step problem. Reference to a Houghton Mifflin text is given.
Baylor College
Living Things and Their Needs: The Math Link
Enrich your study of living things with these cross-curricular math activities. Following along with the story Tillena Lou's Day in the Sun, learners will practice addition and subtraction, learn how to measure volume and length, work on...
Curated OER
Graphs
For beginners to picture graphs this is the perfect resource. They analyze two bar graphs that break down data visually so scholars can actually count the number in each column. For the first, they fill in how many of each type of pet is...
Curated OER
Choose an Appropriate Graph
In this graphs worksheet, students solve 6 fill in the blank problems where they choose the most appropriate type of graph for each set of data and explain why they chose that type. Students use bar graphs, histograms and circle graphs....
Curated OER
Graphing
Students collect data to create different types of graphs-line, pie, and bar graphs. They use StarOffice 6.0 to create graphs.
BW Walch
Solving Systems of Linear Equations
Solving systems of equations underpins much of advanced algebra, especially linear algebra. Developing an intuition for the kinds and descriptions of solutions is key for success in those later courses. This intuition is exactly what...
Curated OER
Build A Skittles Graph
Students explore graphing. In this graphing lesson, students sort Skittles candies and use the color groups to create a bar graph. Rubrics and extension activities are provided.
Curated OER
Raising the Bar While Hogging the Ham (Radio, That Is)
Young scholars watch a Cyberchase video to determine the importance of using the correct scale when making bar graphs. They examine how to use bar graphs to gain information easily. They determine how to use bar graphs persuasively.
Curated OER
Graphing With Candy
Students gather information and interpret the results using a tally chart, a table, and a bar graph.
Curated OER
Double Bar Graphs
In this double bar graphs practice worksheet, students sharpen their problem solving skills as they solve 6 story problems.
Curated OER
Read a Bar Graph
In this bar graph worksheet, students use a bar graph of favorite zoo animals to solve 6 simple word problems. Houghton Mifflin text is referenced.
Curated OER
Bar Charts and Pictographs: How can they help us?
First graders work with manipulatives to solve various math problems by using concrete objects to solve a list of problems . They create and evaluate bar graphs and write a statement about the information on their bar graph.
Curated OER
Temperature Bar Graph
Learners explore mean, median and mode. In this math lesson, students analyze temperature data and figure the mean, median, and mode of the data. Learners graph the data in a bar graph.
Curated OER
Problem Solving Application: Using a Bar Graph
In this bar graph activity, students use a set of 2 bar graphs to answer 6 related questions. Answers are included on page 2. A reference web site is given for additional activities.
Curated OER
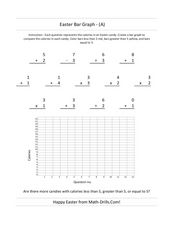
Easter Bar Graph- A
In this Easter math worksheet, students first solve 13 problems with addition, subtraction, multiplication and division. Using the answers, students make a bar graph.
Curated OER
Activity: Make a Bar Graph
In this bar graph activity, students use a given picture to create a graph, then use the graph to solve 2 related problems. Graph is sports related.
Curated OER
Reading Bar Graphs
In this bar graphs worksheet, 8th graders solve and complete 10 different problems that include interpreting two different bar graphs. First, they determine the least profitable year for selling books. Then, students determine the age...
Curated OER
Apple Logic and Problem Solving
Students examine apple production in the United States. In this interdisciplinary lesson, students use problem solving strategies introduced to solve math problems associated with apple production in the United States. Student collect...
Curated OER
Play It
There are a number of activities here that look at representing data in different ways. One activity, has young data analysts conduct a class survey regarding a new radio station, summarize a data set, and use central tendencies to...
Curated OER
Classroom Supplies
Challenge young mathematicians to buy classroom supplies by staying within the means of a $1,000 budget. The mathematical activity provides learners with the opportunity to decide what items from the supply list would benefit a class of...
Curated OER
Bar Graph Questions
In this bar graph worksheet, students solve 10 problems in which information on a bar graph is used to calculate answers. This page is intended as an online activity, but may be completed with paper and pencil.


