Curated OER
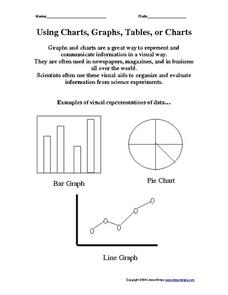
Using Charts, Graphs, Tables, or Charts
In this charts, graphs and tables learning exercise, students view 3 different types of visual representations of data, make a list of 20 items and decide how the items can best be put together in groups to make a graph, chart or table....
Curated OER
"Graph It"
Students work in teams to conduct short surveys of their classmates. They show their results using at least two different types of graphs.
Students separate into teams and are asked that each team to choose something that they are...
Curated OER
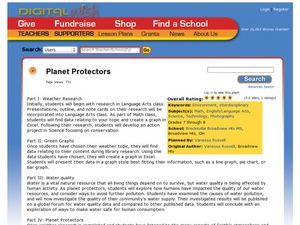
Planet Protectors
Students explore ways to protect the earth. In this environmental issues and technology instructional activity, students investigate the water quality in their community and compare their findings to the water quality in other...


