Shodor Education Foundation
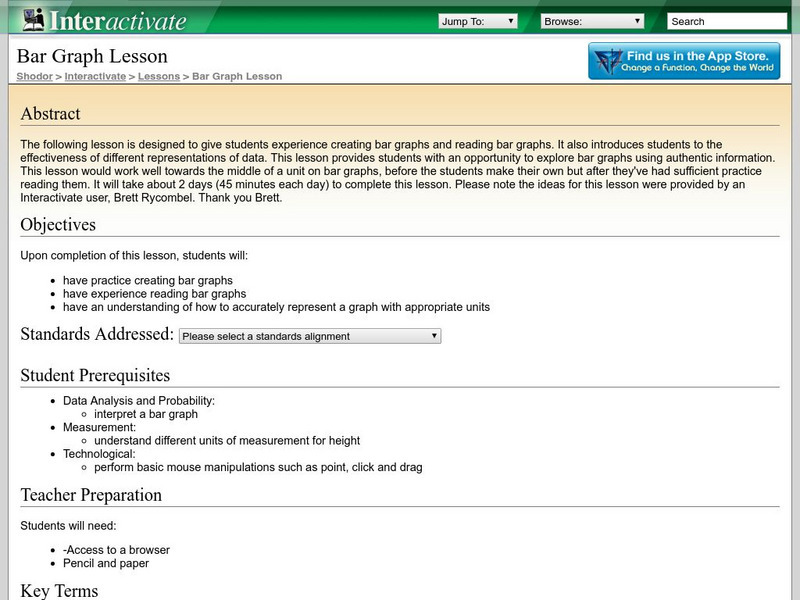
Shodor Interactivate: Lesson: Bar Graph
This lesson is designed to give students practice creating and reading bar graphs as well as understanding how to accurately represent a graph with appropriate units.
Cuemath
Cuemath: Bar Graphs
A comprehensive guide for learning all about bar graphs with definitions, solved examples, and practice questions.
Khan Academy
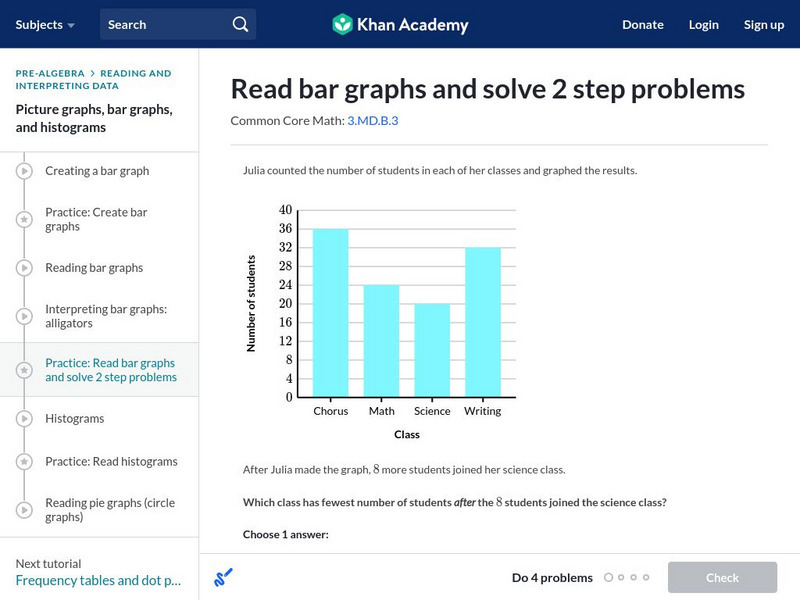
Khan Academy: Read Bar Graphs and Solve 2 Step Problems
Read and interpret a double bar graphs. Students receive immediate feedback and have the opportunity to try questions repeatedly, watch a video or receive hints. CCSS.Math.Content.3.MD.B.3 Draw a scaled picture graph and a scaled bar...
Better Lesson
Better Lesson: Bar Graph Activity
The students will be collecting data from other students to represent in a bar graph. If available, they can then use a computer program called Bar Grapher tool to show their data with a different layout.
Better Lesson
Better Lesson: Building Our Own Bar Graphs (Part I)
Second graders use data to create a tally chart and make a bar graph. This lesson includes a detailed plan, videos of students engaged in the lesson, and printable worksheets.
Science Buddies
Science Buddies: Interpreting Area Data From Maps vs. Graphs
Graphical methods of data presentation are a key feature of scientific communication. This project asks the question, "What's the best way to compare the land area of states: a map or a bar graph?" You'll be measuring performance on two...
Khan Academy
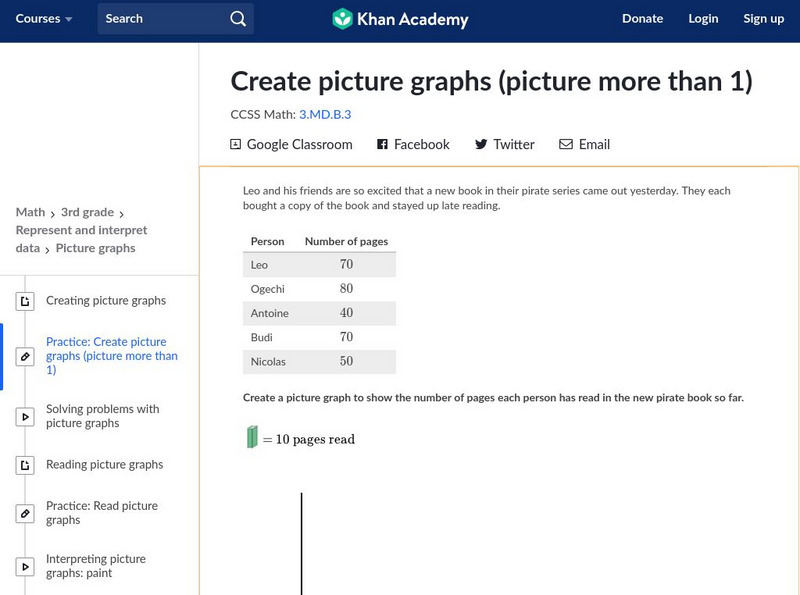
Khan Academy: Create Picture Graphs (Picture More Than 1)
Create and interpret picture graphs. Students receive immediate feedback and have the opportunity to try questions repeatedly, watch a video tutorial, or receive hints about how to create picture graphs. CCSS.Math.Content.3.MD.B.3 Draw a...
Alabama Learning Exchange
Alex: Great Golly Graphs
This lesson plan asks learners to create a survey project including graphs, questions, tables, and data analysis. It gives an assessment and ideas for remediation and extension as well as ways to manage behavior problems and reluctant...
Ducksters
Ducksters: Kids Math: Picture Graphs
Math picture graphs for kids. Pie, line, and bar charts. Learn with problems, examples.
Texas A&M University
Wtamu Virtual Math Lab: Beginning Algebra: Reading Graphs
A good introduction to reading bar, line, and double line graphs, and drawing and reading Venn diagrams. Contains definitions and examples of these types of charts and graphs as well as practice exercises that ask you to answer questions...
Alabama Learning Exchange
Alex: We're in a Pickle
A hands-on lesson in which children work together to discover adjectives, write a descriptive paragraph, and apply math principles to produce a bar graph interpreting results from the lesson.
PBS
Pbs: The Lowdown: u.s. Gun Homicides: Visualizing the Numbers
Explore firearm deaths in the United States in 2010 by type, race, and age group in this interactive from KQED. In the accompanying classroom activity, students are presented with a simple question: Is America a safe place to live? In...
Better Lesson
Better Lesson: Snack Attack
Graphing can be made fun and hands-on with different real world "tools" - like snacks!
TeachEngineering
Teach Engineering: A Tornado in My State?
Students will analyze data of tornadoes throughout the United States. They will create a bar graph of the number of tornadoes for the top ten states in the country and then calculate the median and the mode of the data.
The Math League
The Math League: Using Data and Statistics: Pie Charts
This introductory tutorial about statistical graphing with four examples of how pie charts (circle graphs) are constructed and read.
University of Texas at Austin
Mathematics Teks Toolkit: And We Go Around
Collect and display data using a bar and circle graph to explore fractions and percents.
Physics Classroom
The Physics Classroom: Chart That Motion
This activity is an online, interactive energy bar chart tool that assesses student understanding of the work/energy relationship.
PBS
Pbs Teachers: Supersonic Dream
Examine how fuel use affects the mass of different planes during flight. This activity teaches students how to determine the per person fuel cost of a transatlantic flight for seven airplanes, and display the results on a bar graph....
Alabama Learning Exchange
Alex: M&m's and Blogs: Interpreting Data!
In this hands-on, technology-rich lesson plan, students will interpret data. The students will define words involving graphs, create a bar graph using M&M's, and post information from their findings on the internet. The students will...
TeachEngineering
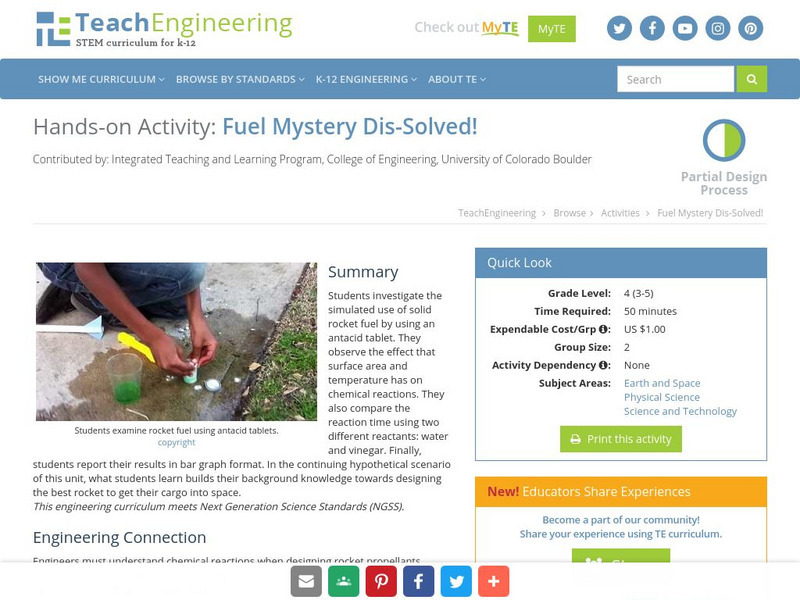
Teach Engineering: Fuel Mystery Dis Solved!
In this activity, students investigate the simulated use of solid rocket fuel by using an antacid tablet. Students observe the effect that surface area and temperature has on chemical reactions. Also, students compare the reaction time...
The Math League
The Math League: Ratio and Proportion
This tutorial provides definitions and examples of ratios and proportions and features comparing ratios and converting rates.
Other popular searches
- Skittles Bar Graph
- Double Bar Graphs
- Bar Graphs Pictographs
- Histogram and Bar Graph
- Bar Graphs and Histograms
- Bar Graph Problem Solving
- Favorite Food Bar Graph
- Bar Graphs Histograms
- Interpreting Bar Graphs
- Bar Graphs for Birthdays
- Bar Graph Worksheet
- Bar Graphs and Charts
