Curated OER
Bar Graphs and Pie Charts
Fourth graders explore their interest and strengths and display them using a bar graph and pie chart.
Curated OER
BUS: Farming: It's A Fact (Ag)
Learners create two different types of graphs from the information in the "Farm Facts" booklet (i.e., bar graph, pie chart, etc.). They calculate where your food dollars are spent (on and off farm).
Curated OER
The Ice Cream Shop
Second graders read books about ice cream and plan an ice cream sundae party for the class. They research ingredients and determine how much the party cost each student. They hold a mock opening for an ice cream store and have their party.
Curated OER
Virginia In the World: The Geography of Commerce
Students examine how Virginia connects with the world through export trade. Using a map, they use symbols to depict the value of trade and the direction of the flow of goods. They complete a scavenger hunt using electronic almanacs and...
Curated OER
Whose Breakfast isn't for the Birds?
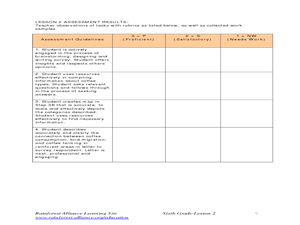
Students explore coffee production. In this cross-curriculum rainforest ecology lesson, students research regions where coffee comes from and investigate how the native birds in the rainforest are effected by coffee...


