Hi, what do you want to do?
Shodor Education Foundation
Shodor Interactivate: Comparison of Univariate and Bivariate Data
Young scholars learn about the difference between univariate and bivariate data and understand how to choose the best graph to display the data.
Illustrative Mathematics
Illustrative Mathematics: 8.sp.4 Music and Sports
This task looks at a possible relationship between playing a sport and playing a musical instrument. Students collect data from classmates, summarize the data into a two-way table, make some observations, and construct a bar graph of the...
Math Slice
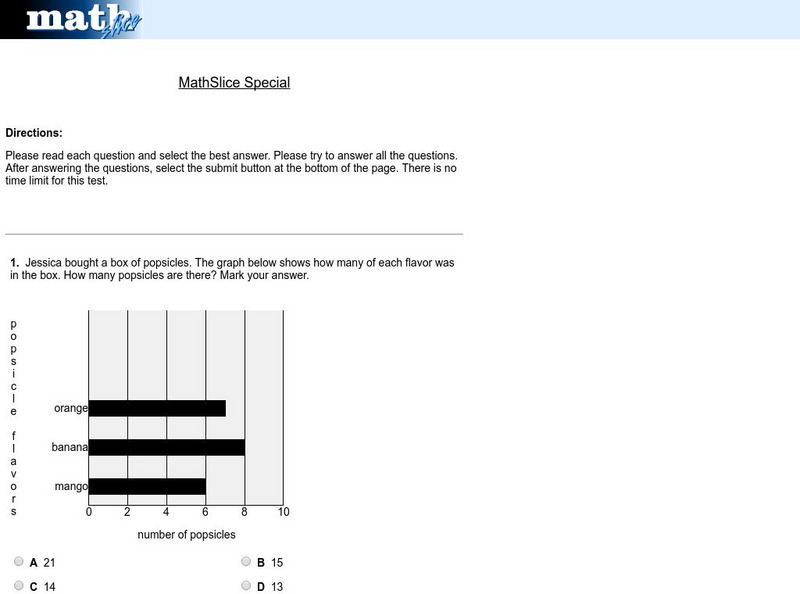
Math Slice: Chart Slice Special Test
A ten question test assessing data collection and analysis skills with bar graphs. Assessment is scored online. An excellent tool for assessment.


