Hi, what do you want to do?
PBS
Pbs Learning Media: Raising the Bar
Harry and Bianca's new boss at a concession stand uses bar graphs to keep records of their refreshment sales in this video from Cyberchase.
University of Illinois
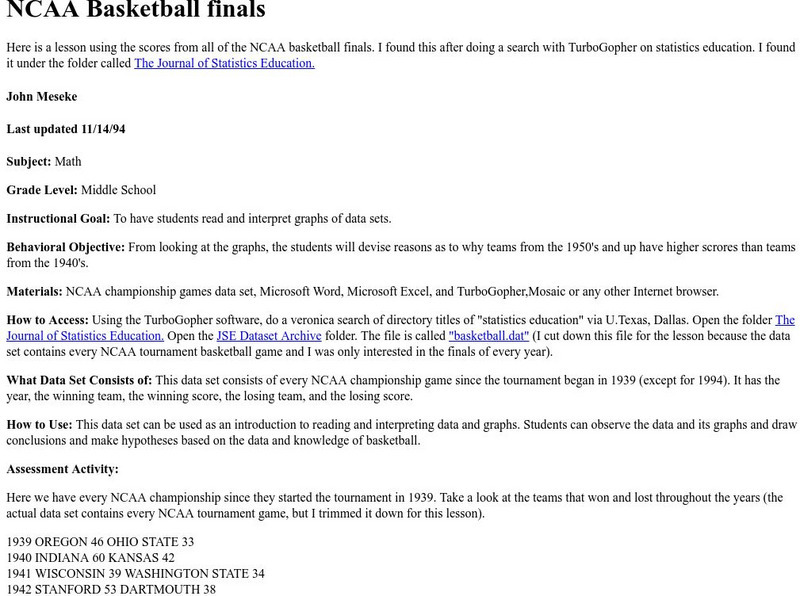
University of Illinois: Ncaa Basketball Finals Bar Graphs
Site from University of Illinois contains a lesson plan that utilizes the NCAA Basketball Final Scores from 1939-1994. Students are instructed to analyze and interpret data displayed in bar graphs.
University of Illinois
University of Illinois: Rollin' Rollin' Rollin'
This resource is the beginning of a series of pages that demonstrates the diffference between the mean and median of a group of numbers. Uses bar graphs to display the data.
University of Illinois
University of Illinois: Rollin' Rollin' Rollin'
This page from the University of Illinois is the beginning of a series that demonstrates the difference between the mean and median of a group of numbers. The sites use bar graphs to display the data.


