Curated OER
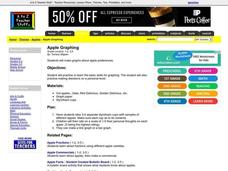
Apple Graphing
Students sample a variety of types of apples and then survey each other regarding their favorites. They chart how many students prefer each type of apple.
Curated OER
How Do I Measure Up? (Intermediate)
Fifth graders compare the relationship between meter in music and measurement in math. They practice sightreading music by determining the number of beats per measure, clapping and counting the rhythm.
Curated OER
General Introduction To Microsoft Word
Fourth graders investigate the fundamentals of using Microsoft Word. They practice using the common word processing techniques. Students practice composing a document and experiment with changing font sizes, editing tools, saving, and...
Curated OER
The Environment and Interactions of Living Organisms
Learners study the environment and interactions of living organisms. They identify abiotic and biotic factors and create a foldable and vocabulary cards. They create a poster illustrating soil and watch a video to study symbiosis.
Curated OER
Education for Global Peace
Fifth graders construct data graphs based upon sets of data. In this graphing lesson, 5th graders read the text If the World Were a Village and discuss how types of graphs accurately represent a large population. Students construct their...
Curated OER
Data Analysis
In this data analysis worksheet, students solve and complete 4 different types of problems. First, they reduce the data provided to find the means, and graph the means in a line graph. Then, students graph the data from each mixture...
Curated OER
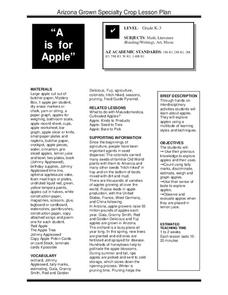
A is for Apple
Students participate in a variety of activities to learn about apples. Students graph apples, learn about apple uses, taste apples, and observe what happens when apples are dipped in lemon juice.
Curated OER
The Sum of All Angles
Students add up the different angles using the angle addition postulate. In this geometry lesson, students differentiate between interior and exterior angles. They calculate the different angles for triangles and use proof to show their...
Curated OER
Favorite Christmas Carols
Third graders take a survey of friends' and family members' favorite Christmas carols. They illustrate a favorite Christmas carol and have students try to guess the name of the carol based on the picture.
Curated OER
How Are Students Doing on the AP exams?
Students compile and analyze data pertaining to College Credit AP Exams. They pose questions - Which exam is the easiest? - determine answers from their data and display their results.
Curated OER
A Bird's Eye View of our 50 States
Third graders focus on state birds as they learned absolute location (latitude/longitude) of each state, as well as their relative location (bordering states).
Curated OER
Count Down
Students are introduced to useing websites as a data source. Using bird population predictions, they test their predictions from various websites. They record, organize and graph the data and share their results with the class.
Curated OER
Fish Workings
Students observe, hypothesize, and draw conclusions regarding fish. They examine their anatomy, and how they function in their environment.
Curated OER
ExplorA-Pond: 6th Grade Area and Random Number Tables
Sixth graders estimate the surface area of a pond using a random number table.
Curated OER
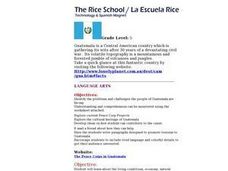
Guatemala
Fifth graders explore what types of projects the Peace Corp is doing to help Guatemala.
Curated OER
Comparing Amount of Rainfall in Different Geographical Areas
Students construct rain gauges and use them to log rainfall in their school zone, local city, and region and then compare and discuss them by plotting this information.
Curated OER
Analytical Spectroscope
Students using a spectroscope view different substances when heated with electricity.
Curated OER
It Takes All Kinds!
Students view video clips and observe similarities and differences between animals. They sort animals into groups for a zoo. They make a graph of their observations and review scientific classifications.
Curated OER
Jazz: Expression through Improvisation
Students watch a video on improvisation. They improvise original melodies over given chord progressions. They develop criteria to evaluate the merits of improvisational performances and apply the criteria in their personal listening and...
Curated OER
Data Shuffle
Young scholars find an advertisement or newspaper using charts or graphs. They create another graph using the same information in a different format. They write a comparison of the two graphs.
Curated OER
The Effects of Environment on Plant Growth: Selecting Seeds for Survival on a New Planet
Fifth graders conduct experiments to compare seed germination and plant growth rates. They construct a hydroponic plant unit and a lighthouse. They care for the plants for a month and collect data for graphs. They write a report.
Curated OER
Measurement: Using the balance
Students use a balance and gram cubes to measure several different objects. They then record their results on a data chart and answer questions about them.
Curated OER
Hey, Look Me Over!
Students make observations about mealworms using hand lenses, rulers, and cotton swabs. Students complete their own mealworm observation chart, then they share their observations with the class. This is one station out of five in an...


