Curated OER
Real World Equations!
Help your math class "get the picture" in a quadratic equation lesson that integrates digital photography. Individuals take pictures to help them model the shape of an item or situation using algebraic equations. They discover how to...
Curated OER
China's Population Growth
Learners collect data from China's population growth and determine the mean, median, and mode from the data. In this data lesson plan, pupils determine probabilities and use them to make predictions.
Curated OER
Tarantula Shoes
Learners read a book about Ryan O'Keefe, a young man who wants a pair of basketball shoes promoted by a basketball star. They explore about spending, saving, opportunity cost, and trade-offs as they study Ryan's decisions throughout the...
Curated OER
Measuring Up on the Mayflower
Second graders use a meter tape to compare the length of the Mayflower to a basketball court and make homemade butter for crackers. Afterward, all students sit inside the makeshift Mayflower's dimensions and enjoy their Pilgrim butter.
Curated OER
Volume of Solid Figures
Learners calculate volume using the correct formula and the correct unit. They explore different prisms, spheres, cubes, and cones as they calculate volume and relate it to depths in oceans.
Willow Tree
Data Sampling
Some say that you can make statistics say whatever you want. It is important for learners to recognize these biases. Pupils learn about sample bias and the different types of samples.
Curated OER
One-Variable Inequality Word Problems
Here is a great set of eight scenarios that require the writing of a one-variable inequality and then solving to find the solution. This inequality word problem activity is then followed by the solutions to each of the eight problems.
Willow Tree
Circle Graphs
Pie isn't just for eating! Scholars learn to create pie charts and circle graphs to represent data. Given raw data, learners determine the percent of the whole for each category and then figure out the degree of the circle that percent...
Curated OER
Badminton or Basketball?
Students explain why for a group of n people, there are an equal number of possibilities for subgroups of size k (such that k < n) and size n - k.
Curated OER
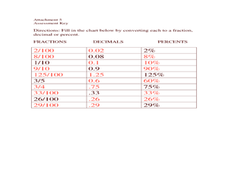
Convert among decimals, fractions, and percents
Seventh graders convert among decimals, percents, and fraction with and without a calculator. In this seventh grade mathematics lesson plan, 7th graders explore strategies that help them to remember how to perform the needed operation...
Curated OER
Basketball And Mathematics
Eighth graders collect and analyze data about foul shots taken at basketball games.
Curated OER
Percentages in Word Problems
Eighth graders, after brainstorming all the places they see percentages in every day life (sales, basketball, grades, etc.), calculate percentages from bases and parts in word problems. They review their notes together on percentage...
Curated OER
Figure This Out
Students measure different parts of the human body. In this measurement lesson, students work in pairs to take measurements of human measurements which include: arm span, height, foot length, and wrist to longest finger. They also...
Curated OER
Get On Board
Students create a ticket table illustrating the cost of tickets by alternative transportation. In this number sense lesson, students write number sentences to compare and contrast difference information in their chart. Students figure...
Curated OER
On the Road Again
Young scholars work with patterns to develop formulas that will help them determine total cost. For this patterning lesson, students watch a video about an NBA trainer. (not included) They work in groups to access the assigned Internet...
Curated OER
Science of Special Effects
This is a creative, multidisciplinary, well-designed lesson provided by Scientific American related to special effects. Students make their own animated short films and use math and computer skills.
Curated OER
Indirect Measurement with Similar Triangles
Students use similar triangles to find missing heights. In this using similar triangles to find missing heights instructional activity, students use proportions to find the heights of missing side lengths. Students find the height of...
Curated OER
Volume and Surface Area of Right Rectangular Prisms
Students identify the formulas for three-dimensional figures. They use manipulatives to model problems. Students create foldables and explain volume and surface area. Students complete worksheets and classify solids. Students sing a...
Curated OER
Circles all Around
Young scholars investigate circles. In this middle school mathematics lesson, students explore the relationship between the diameter of a circle and its circumference.
Curated OER
Teen Entrepreneurship
High schoolers explore teen entrepreneurs. In this teen entrepreneurship lesson, students examine teen entrepreneurs and answer questions about the real-word situations. High schoolers role play and explore the basic characteristics of...
Curated OER
Explore the Elements of Art
Students recognize elements of art such as texture, shape line and color. In this elements of art instructional activity, students create a still life picture with oil pastel or crayons. Students define elements of art vocabulary....
Curated OER
Analyzinf Equations Through Slope and Y intercept
Students solve equations representing exponential functions. In this algebra lesson plan, students interpret their equations by analyzing the slope and y intercept. They find the slope using the slope formula.
Curated OER
Triangles
Fourth graders participate in three experiments to gain understanding of triangles. In this triangles lesson, 4th graders use pipe cleaners to create bubble pipes, basketball hoops and bingo cards to display the characteristics of...
EngageNY
Describing a Distribution Displayed in a Histogram
The shape of the histogram is also relative. Learners calculate relative frequencies from frequency tables and create relative frequency histograms. The scholars compare the histograms made from frequencies to those made from relative...


