Curated OER
Charting Seasonal Changes
Learners research the Earth's patterns of rotation and revolution, create a chart and graph of these patterns and use them to explain the causes of night and day and summer and winter.
Curated OER
CHARTING NEPTUNE'S REALM
Students design a twenty-first century book cover based on the concepts and designs of the eighteenth century.
Curated OER
Maps, Charts, and Graphs
Students define key geographic terms and track a hurricane on a map. They examine various types of maps and find locations on them,including rivers, cities and mountains.
Curated OER
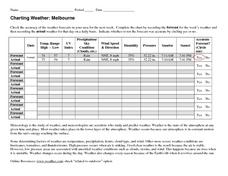
Charting Weather: Melbourne
In this earth science instructional activity, learners check the accuracy of the weather forecasts in their area for a week. Then they complete the chart by recording the forecast for the week's weather and then recording the actual...
Curated OER
Charting Diversity
Students organize different species of plans and animals according to various characteristics. Students then determine what characteristics enable them to survive in their habitat. Game ideas and activities are included.
Curated OER
My Favorite Birthday
Students collect and organize data from classmates, display data on simple chart, and plan class birthday party.
Curated OER
Weather Graphing
Every morning students complete the weather chart. They use colors to reflect the cloud cover and symbols for rain, snow, etc.
Curated OER
Cause and Effect
Third graders investigate cause and effect. In this cause and effect lesson, 3rd graders read a story and determine what are the causes and effects. Students match sentence strips to the make the correct cause and effect sentence....
Curated OER
Charting The Planets
Learners conduct different activities in order to unlock the secrets of the universe. They answer different questions that are written to assess knowledge of the planets. Information can be found on the internet to help.
Curated OER
Tally Charts and Graphs
Fourth graders play the game 'Data Picking', where they collect data, place the data into a tally chart, and choose the circle graph that best represents the data. They go to the Mathfrog website and select 'Picking'. Students choose...
Curated OER
Activity Plan 4-5: I'm Graphing to Know You!
Students create graphs about themselves to learn more about one another. In this early childhood math lesson, students record information about one another as they make picture graphs.
Curated OER
A Planet Full of Animals
Students study animals and practice classifying them through observation activities. In this animal classification instructional activity, students complete a KWL chart about animals. Students then sort pictures of animals into chart...
Curated OER
Fore!
In this golf worksheet, students fill in data in a chart about 6 tournaments and answer short answer questions about it. Students fill in 18 spaces in the chart and answer 2 questions.
Curated OER
Charting Animal Life Spans
Second graders research animal life spans and complete related math activities. In this life span lesson, 2nd graders read How Many Candles and discuss life spans. Students arrange animal cards based on their life spans. Students find...
Curated OER
Charting Mold Growth
Students chart mold growth based on food supply. In this mold growth lesson plan, students chart micro-organism growth and the decline of the growth as food runs out.
Curated OER
Table Readings
In this table activity, students read questions and interpret tables. Questions include information concerning unemployment, oil imports, and foreign students. This multiple-choice activity contains 10 problems. ...
Curated OER
Country Locations
First graders read a story and locate where the countries in the story are located. In this traditions lesson, 1st graders explore food dishes from different countries and discuss where they are located. Students tell their favorite...
Curated OER
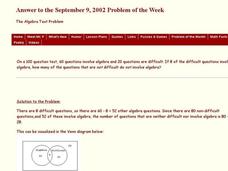
The Algebra Test Problem
In this algebra test worksheet, students construct and interpret a Venn Diagram. They determine the type of algebra problems designated in the Venn Diagram. This one-page worksheet contains 1 problem. The answer is...
Curated OER
Earthquake on the Playground
Students investigate earthquakes by examining chart data. In this disasters lesson, students identify the waves that are recorded when an earthquake arises by reading sample graphs in class. Students participate in an...
Curated OER
Dialogue Tags/ Synonyms for Said
Sixth graders analyze dialogue tags. In this synonyms lesson students work in groups analyzing a personal narrative. They enter the words onto a classroom chart as well as their notes or journal. The students replace tags with more...
Curated OER
Charting the Course
Students list and describe the characteristics of a good citizen relative to democracy. They see that philanthropy is part of good citizenship and exemplify philanthropy through random acts of kindness. Each group will be responsible for...
Curated OER
Scientific Method
In this science worksheet, students identify and locate each of the words to the right in the word search puzzle on the left. Then they list as many words as they can from the letters in scientific method.
Curated OER
Using A Table
For this table worksheet, students observe information in a table, and then answer ten questions pertaining to the information. They must correctly read a table in order to arrive at the correct answer. Questions pertain to features of...
Curated OER
Weather Calendar
In this weather calendar activity, learners read the calendar and identify the type of weather that occurred on that date. They also determine the total number of days that were cloudy, sunny, etc. There are 9 questions on this...
Other popular searches
- Charts and Graphs
- Multiplication Charts
- Maps and Charts
- Tally Charts
- Pie Charts and Graphs
- Pie Chart
- Multiplication Charts to 100
- Reading Charts and Graphs
- Behavior Charts and Graphs
- Charts and Graphs Candy
- Interpret Charts and Graphs
- Charts and Graphs Christmas


