Curated OER
Bell Curve
Students explore averages by completing a data analysis activity. In this bell curve lesson, students measure different food items and plot their measurements on a X and Y axis. Students create bell curves around the average weight or...
Curated OER
Bell Curve
Young scholars construct two bell curves using two different yet related objects. For example, two kinds of Hershey's Kisses (plain and almond) or two kinds of dried beans (kidney and lima).
Curated OER
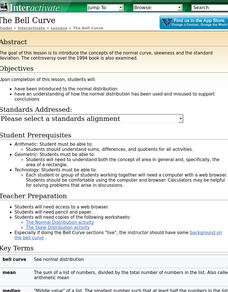
The Bell Curve
Learners are introduced to the concepts of the normal curve, skewness and the standard deviation. They discuss how the normal distribution has been used and misused to support conclusions.
Curated OER
The Bell Curve
Students explore the concept of the bell curve. In this bell curve lesson, students discuss the controversy associated with the bell curve. Students use an applet to explore a normal distribution. Students discuss mean, median, mode,...
Curated OER
Bell Curve
Young scholars explain normal distribution of a measurable characteristic within a group of objects. They create two graphs (one for each type of Hershey's Kiss) with increments of measurement on the X-axes and number of measurements on...
Curated OER
The Bell Curve
Students are introduced to the normal distribution and examine the bell curve controversy.
Curated OER
Probability
Students complete various activities for probability. In this probability lesson plan, students use coins, cubes, peanut butter and jelly, playing cards, number cubes, darts, and a Gauss Curve to study probability. Students must orally...
EngageNY
Using a Curve to Model a Data Distribution
Show scholars the importance of recognizing a normal curve within a set of data. Learners analyze normal curves and calculate mean and standard deviation.
Curated OER
Assessing Normalcy
Students define normal distribution as it relates to the bell curve. In this statistics lesson, students use the central tendencies of mean, median and mode to solve problems. They plot their data and draw conclusion from the graphs.
Curated OER
Sampling Rocks
Students examine how to take a sample by looking at rocks in the schoolyard. In this sampling instructional activity, students discuss ways to classify rocks by color, size, and weight. They think about how many rocks would make a good...
Curated OER
Worksheet for Pi
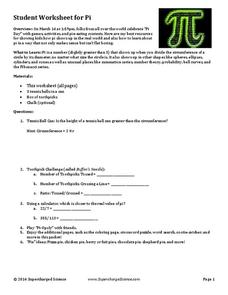
Who needs a pie-eating contest when you have a pi-ology game! Celebrate March 14th with a fun board game about pi and other geometric concepts. As learners answer questions about geometry, they move around the board to collect tokens.


