Curated OER
Determining the Density of a Drop of Water-A Graphing Exercise
Students determine the density of 1 drop of water. In this determining density lesson plan, students determine the mass and volume of a drop of water in the lab using appropriate lab techniques and calculate the density of a drop of water.
Curated OER
The Big Bang-Hubble's Law
In this Hubble's law worksheet, students use data for galaxies which include their distance and speed. Students make a graph to show the distance to each galaxy and the speed of each galaxy. They use their graph to answer 4 questions...
Curated OER
Composing Your Melody
In this music worksheet, learners perform a given melody of four phrases. Students also improvise their own melodies using notes G, A, C, D, and E.
Curated OER
Flight Paths of Orbiting Satellites
Students examine the path a satellite follows as it orbits the earth. In this space science instructional activity, students use a globe as they illustrate a satellite in its orbital plane, then plot points on the satellite's path on the...
Curated OER
Walking the Plank: Student Worksheet
In this math worksheet, students will work in a group to experiment with the weight of objects when placed at a distance from a scale (using a plank). Students will record and graph their results.
Curated OER
Density of Pennies Lab
In this density of pennies worksheet, student conduct an experiment to determine the metals used in the core of pennies made after 1983. High schoolers design their own experiments using a balance and graph paper to determine the density...
Curated OER
Making Effective Decisions
Students examine decision-making styles. In this self-awareness instructional activity, students work through 3 exercises examining the different styles of decision-making, how barriers effect decision-making. The instructional activity...
Curated OER
Sand Painting Mural
Third graders design and create classroom sand painting mural which is comprised of individually designed pieces.
Creative Chemistry
Thermometric Titration
In this thermometric titration learning exercise, students titrate hydrochloric acid with sodium hydroxide to determine its concentration. They measured the solution's change in temperature, plotted their data, and used the graph to find...
Curated OER
How Hot is that Star?: Astronomy, Sun, Solar Temperature, Science
Students explain sun facts and solar information. They discover how temperature of a star is measured. They investigate the various scales used to measure temperature. They observe images of the sun. They classify stars according to te
Curated OER
Worksheet 7/7 on Verbs
In this recognizing verbs that have been used as sentence openers activity, learners read a passage, identify the verb openers, and list them. Students list 10 answers.
Curated OER
Worksheet 2/7 on Collective Nouns
In this recognizing collective nouns worksheet, students use collective nouns in a word bank to fill in the blanks in sentences. Students write 7 answers.
Curated OER
Calculator-Based Lessons Help Examine Real-World Data
Students may determine equations based on graphs and regression models.
Curated OER
Handling Data: Representing Date - Online Version
Here is an online lesson plan on data representation. In it, learners access websites embedded in the plan which lead them through a variety of activities around data representation and statistics. The activities are quite good, and...
Curated OER
Gender and Income
Students investigate Income and gender preference. In this statistic lesson, students collect data of Income to see if one gender makes more than the other. Students examine the data and draw conclusions.
Curated OER
Point Graphs
Students experiment with point graphs. In this math activity, students are divided into groups and perform an experiment to see how high a ball bounces, recording their results on a point graph. Students then answer provided questions.
Creative Chemistry
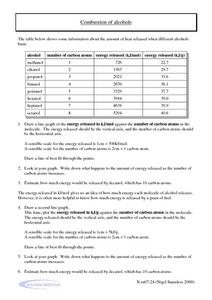
Combustion of Alcohols
For this combustion worksheet, learners complete two problems using a table showing the amount of heat released when different alcohols burn. They then create two graphs plotting the energy release against the number of carbon atoms.
Curated OER
Graphing in Science
Students manipulate and interpret data. They are given a dataset from a described experiment and interpret the data. A "How to Sheet for graphing" is included in lesson plan.
Curated OER
Optimization For Breakfast
Young scholars identify he proportion of a cereal box. In this algebra activity, students define the relationship between patterns, functions and relations. They model their understanding using the cereal box.
Curated OER
Move It
Studens collect and graph data. In this algebra lesson, students use a CBL and CBR with a TI Calcualtor to observe linear graphs. They use the correct vocabualry as they discuss the collected data.
Curated OER
Beginning Modeling for Linear and Quadratic Data
Students create models to represent both linear and quadratic equations. In this algebra lesson, students collect data from the real world and analyze it. They graph and differentiate between the two types.
Curated OER
Numerical Analysis: Discrete Least Squares
In this discrete least squares worksheet, students use a linear algebra approach to discrete last squares approximation. This two-page worksheet contains approximately 10 problems.
Curated OER
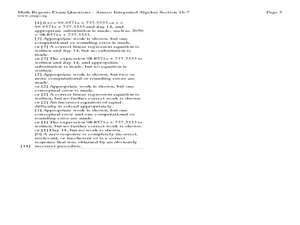
Fourteen Math Regent Exam Statistics Questions on Scatter Plots and Linear Regression
For this linear regression worksheet, students solve fourteen Math Regent Exam questions regarding scatter plots and linear regression. The solutions are provided.
Other popular searches
- Line of Best Fit
- Best Fit Lines
- Lines of Best Fit
- Best Fitting Line
- Math Best Fit Line
- Algebra Line of Best Fit
- Best Fit Line Worksheets
- Correlation Best Fit Lines
