Curated OER
The Fuelish Fact Finding
Learners define fluctuation and the price of food. In this algebra instructional activity, students create a budget to live on based on their living expenses. They create a chart and explore the cause and effect of real life scenarios.
Curated OER
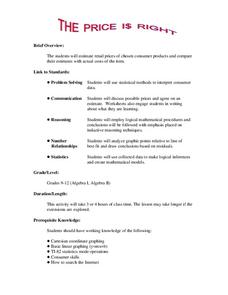
The Price Is Right
Students create a list of products with estimated prices. For this algebra lesson, students learn to write equations using variables. They match their created list with that of actual products and compare their prices,
Curated OER
Online Interactive Math: Upper Elementary: Mixed Skills
In this online math worksheet, students complete a 20 problem multiple choice online interactive worksheet with mixed skills including geometry, rounding, and three digit multiplication.
Curated OER
Evaluative Reading Comprehension
For this reading worksheet, students answer multiple choice questions about reading lists, classifying, grouping sentences, and more. Students complete 20 problems.
Curated OER
The Closer I Get To You
Pupils explore the law of reflection. Through experimentation and problem solving, they collect and analyze data pertaining to reflection. The data is plotted on a graph and formulas for calculating the x and y values are evaluated.
Curated OER
Perimeter and Area
Fifth graders identify the area and perimeter of a rectangle. In this perimeter lesson, 5th graders use geoboards and rubber bands to construct various rectangles. Students use the formula to calculate area and perimeter of the...
Alabama Learning Exchange
The Composition of Seawater
Young scholars explore the concept of finding the composition of seawater. In this finding the composition of seawater instructional activity, students make a saturated salt water solution. Young scholars discuss why there is...
Curated OER
Confusing Colors!
Fourth graders collect data, graph their data, and then make predictions based upon their findings. They's interest is maintained by the interesting way the data is collected. The data collection experiment is from the psychology work of...
Curated OER
Statistical Accuracy and Reliability
Ninth graders assess the accuracy and reliability of current survey data and how it is represented. They design a survey, collect data, and use technology to analyze the data and present the results. Students examine scatter plots and...
Curated OER
M&M Exponential Activity
Students create a scatter plot of their experimental data. In this algebra lesson, students use M&M's to determine an algebraic model. They discuss results in class.
Curated OER
Lesson Plan On Fran Data
Seventh graders investigate the concept of functions and how they are used in the context of the real world while identifying the dependent and independent variables. They graph relations and functions and find the zeros of functions....
Curated OER
Itty-Bitty Teeny-Tiny Word Books
In these worksheets, 1st graders will construct two itty bitty word books. Students will create a book of words pertaining to the zoo and the farm and color the pictures in each.
Curated OER
Performing Gospel Music (Keyboard or Piano)
For this music worksheet, students learn to play a piece of gospel music called "Siyahamba" on the piano or keyboard. Students examine the musical notes written on the staffs and read the helpful hits in the margins. Piano knowledge is...
Curated OER
Puzzle Quilts
High schoolers watch a demonstration on how to create a puzzle quilt. Using different fabric combinations, they use each block design twice to create the illusion that each block is unique. They are to determine which blocks are the...
Curated OER
The Bigger they Are . . .
Pupils do a variety of data analyses of real-life basketball statistics from the NBA. They chart and graph rebounding, scoring, shot blocking and steals data which are gathered from the newspaper sports section.
Curated OER
Walking the Plank
Eighth graders experiment with a bathroom scale, books and a plank to determine how weight readings change as distance is applied. They graph and interpret the results.
Curated OER
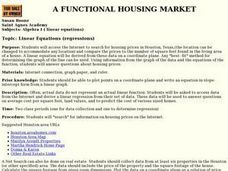
A Functional Housing Market
Students access the Internet to search for housing prices in Houston, Texas,(the location can be changed to accommodate any location) and compare the prices to the number of square feet found in the living area of a house.
Curated OER
Viewing Tubes
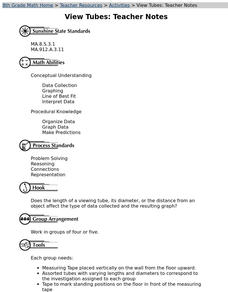
Students complete a lab in order to discover if the length of a viewing tube, its diameter, or the distance from an object affect the type of data collected and the resulting graph.
Curated OER
View Tubes
Eighth graders decide if the length of a viewing tube, its diameter, or the distance from an object affects the type of data collected and the resulting graph through a series of experiments.
Curated OER
Human Evolution
Students make and use observations of Laetoli footprints to provide clues to life in the past. They collect and analyze data to study the relationship between foot length and body height.
Curated OER
Plot! Analyze! Draw your Conclusions!
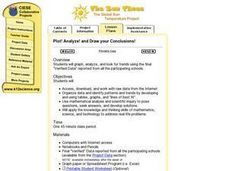
Students download data reported from the Global Sun Temperature Project website. They graph and analyze the data looking for trends and patterns. They prepare a class report with their observations and post it to the website.
Curated OER
Measuring Mania
Students rotate through stations in the classroom, completing different types of measurements. These measurements are placed into a spreadsheet, and a scatter plot is generated. They type an explanation of their results in correlation...
Curated OER
Mathematical Techniques - Basic Graphing
Students are introduced to significant figures and how to add, subtract, multiply and divide them. In a group, they practice plotting data points from a table to a graph and labeling all axes. They calculate the slope and y-intercept and...
Curated OER
Trends in Precipitation
Eighth graders study about precipitation and graph the information. They look for patterns in a scatter graph and make inferences based on what they see. They need to see a relationship between location and the amount of precipitation.
Other popular searches
- Line of Best Fit
- Best Fit Lines
- Lines of Best Fit
- Best Fitting Line
- Math Best Fit Line
- Algebra Line of Best Fit
- Best Fit Line Worksheets
- Correlation Best Fit Lines

