Curated OER
Bouncing Ball
High schoolers collect height versus time data of a bouncing ball using the CBR 2™ data collection device. Using a quadratic equation they graph scatter plots, graph and interpret a quadratic function, apply the vertex form of a...
Curated OER
Bouncing Ball : Function Families
A bouncing ball serves as more than entertainment when learning to apply quadratic functions to real-world events. This is the second of a two-part lesson, which can also be accessed from the website. The instructions say to measure the...
Curated OER
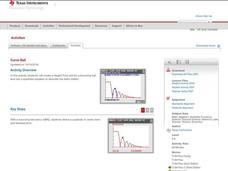
Curve Ball
Learners explore the concept of parabolas by collecting quadratic data on a bouncing ball as it is falling using a motion detector. They plot the data and determine the equation of the quadratic in vertex form, then determine the values...
Curated OER
Collecting Ball Bounce Data
Learners investigate quadratic equations as they use a CBR to collect and analyze data regarding a bouncing ball. Pupils explore different methods for determining the equation of the parabolic path including quadratic regression and...
Curated OER
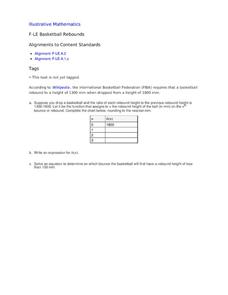
Basketball Rebounds
Your young basketball players will build a table and develop a general formula for a decaying exponential scenario involving the rebound distance of a bouncing ball. Using a CBR and graphing calculator can make this even more hands-on...
Curated OER
Bouncing Ball Experiment
Students collect data for a bouncing ball and select one bounce to analyze. They explore the relationship between velocity, position and acceleration. They seek out connections between the graphs and the physical motion of the ball.
Curated OER
Exploration Sequence of Bounces
New skills are developed as students use graphing calculators and ranger technology to capture and graph the sequence of bounces a ball makes when dropped. After recording the height of four or more bounces, they use the collected data...
Curated OER
Exploring Quadratic Data with Transformation Graphing
Using a data collection device to collect data regarding a bouncing ball, students use various features on graphing calculators to experiment with the parameters of the vertex form of the parabola and their effect on the shape of the...
Curated OER
"Ball Bounce" Quadratic Functions
Young scholars manipulate a ball and explore quadratic functions. In this algebra instructional activity, learners analyze the graph of a quadratic function. They identify quadratic properties.
Curated OER
Exploring Quadratic Data : Transformation Graphing
High schoolers analyze the vertex form of a parabola and find an approximate fit of a model. They explain the quadratic parabola function and its properties by developing quadratic models. They use translation and dilation to change the...
Curated OER
Quadratic Applications
In this quadratic applications worksheet, students complete graphs, charts, comparison charts, and more having to do with quadratic equations. Students complete 5 different activities.
Curated OER
Lesson Plan 1: Up, Down, Right, Left - Function Families
Students work in small groups to draw the trajectory of several scenarios. They label parts of the resulting parabola (vertex, axis of symmetry). Students complete four stations to explore quadratic functions.
Texas Instruments
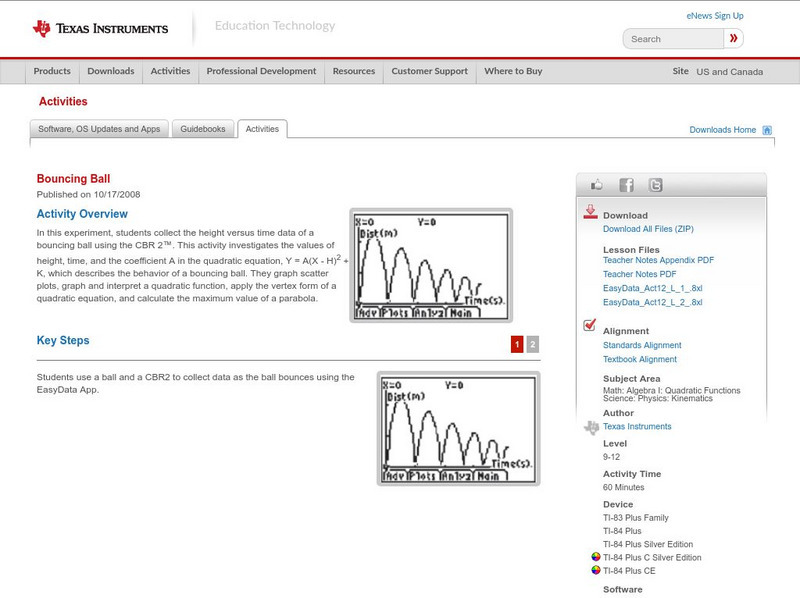
Texas Instruments: Bouncing Ball
In this experiment, students collect the height versus time data of a bouncing ball using the CBR 2. This activity investigates the values of height, time, and the coefficient A in the quadratic equation, which describes the behavior of...
Texas Instruments
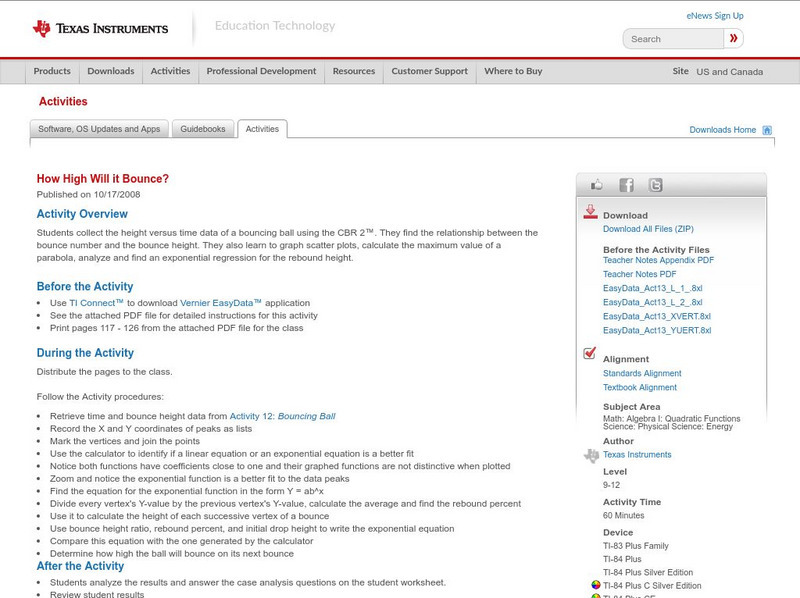
Texas Instruments: How High Will It Bounce?
In this activity, students collect the height versus time data of a bouncing ball using the CBR 2. They find the relationship between the bounce number and the bounce height. They learn to graph scatter plots, calculate the maximum value...
Texas Instruments
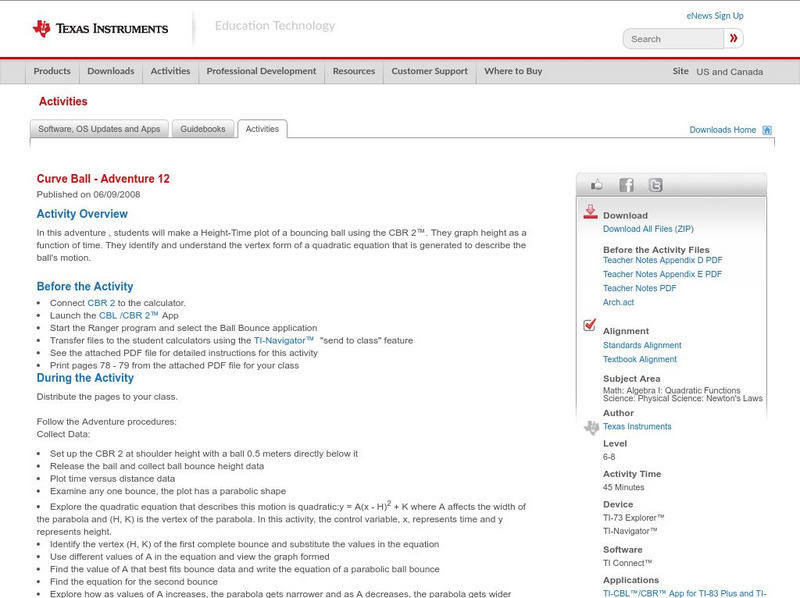
Texas Instruments: Curve Ball Adventure 12
In this adventure , students will make a Height-Time plot of a bouncing ball using the CBR 2. They graph height as a function of time. They identify and understand the vertex form of a quadratic equation that is generated to describe the...

