Curated OER
Integrate Algebra Regents Exam Bimodal Questions Worksheet #1
In this Integrated Algebra worksheet, students solve problems that reflect the topics covered during the course of work. The answer key identifies each question by standard and topic. The twenty-four page worksheet...
Curated OER
2D Wavelet Transform
In this 2D wavelet transform worksheet, students compute 9 different types of problems related to using wavelets. They select a set of orthogonal filters, load in any image they want, and compute by the given command. Then, students...
Curated OER
Histograms and Bar Graphs
Students are introduced to histograms, bar graphs, and the concept of class interval. They use an activity and three discussions with supplemental exercises to help students explore how data can be graphically represented (and...
Curated OER
Sets an the Venn Diagram
Young scholars explore the characteristics of sets and Venn Diagrams. Given data, students practice determining the placement of elements in a Venn Diagram. Young scholars discuss the correspondence between data sets and their...
Curated OER
Different Perspectives of Oregon's Forest Economic Geography
Students map data on employment in wood products manufacturing in Oregon counties. In this Oregon forest instructional activity, students discover the percentage of people employed in the forest manufacturing industry. Students create a...
Curated OER
Statistics: Misleading or Accurate?
Students explore the concept of misleading statistics. In this misleading statistics lesson plan, students play a game of tag and graph the number of times each student gets tagged. Students use the graph to determine the fastest...
Curated OER
A Place In Space
Students work together to create a 3D coordinate system. They plot points that are given to them and asked to find these points in space. They discover how engineers use coordinates in their careers.
Curated OER
Coordinate Plane Treasure Hunt
Middle schoolers create a treasure map by plotting points on a coordinate plane using a computer drawing program. Students name and identify different landmasses and structures on their map. They create instructions to find the...
Curated OER
Analyzing Graphs and Data
Students collect and analyze data. In this statistics lesson, students graph their data and make inferences from the collected data. They display their data using graphs, bar graphs, circles graphs and Venn diagrams.
Curated OER
Mathematical Models with Applications: The Sounds of Music
Students use an electronic data-collection device to model the sound produced by a guitar string. They identify the graph of a periodic situation and use the graph to determine the period and frequency of sound waves.
Curated OER
Comparison of Two Different Gender Sports Teams - Part 1 of 3 Measures of Central Tendency
Young scholars gather and analyze data from sports teams. In this measures of central tendency lesson, students gather information from websites about sports team performance. Young scholars analyze and draw conclusions from this data....
Curated OER
Statistical Analysis of Data by Gender
Students examine and identify gender bias, stereotyping, and discrimination in school materials, activities, and classroom instruction. They apply descriptive statistics knowledge to real-world data.
Curated OER
Scatter Graphs
In this scatter graphs worksheet, students learn a way of illustrating information about two related values. Students complete 30 questions about the graphs. Note: One of the graphs has English pounds. This is intended as an online...
Curated OER
A Statistical Look at Jewish History
Students complete their examination over the Jewish Diaspora. Using population figures, they discover the importance of percentages in exploring trends. They use their own ethnic group and determine how it is represented in the United...
Curated OER
Two-Step Linear Equations
In this two-step linear equations worksheet, 7th graders solve 15 various problems that include linear equations with more than one-step. First, they need to get the variable, x, alone by subtracting/adding the whole number on the same...
Curated OER
Get a Half Life!
Eighth graders use M&M's to experiment with data. They use a graphing calculator to determine the best equation for their data; linear, quadratic or exponential. They analyze the data to find the half-life of their M&M's.
Curated OER
Comparing Negative Fractions, Mixed Numbers and Decimal
Seventh graders explore the concept of negative rational numbers. In this negative rational numbers instructional activity, 7th graders discuss similarities between positive and negative rational numbers. Students predict what rational...
Curated OER
Census Statistics and Graphing
Students graphically represent data from the Census. In this middle school mathematics lesson, students investigate the housing characteristics of different tribes of Native Americans and compare them to the average American...
Curated OER
Live, From New York
In this data analysis worksheet, students study the information on a data table about the hosts of Saturday Night Live. Students answer 8 problem solving questions about the table.
Curated OER
Mean and Median
Students identify the different central tendencies. In this probability lesson, students create the correct type of graphs to analyze their data. They make predictions and draw conclusions from their data.
Curated OER
Graph Functions: Practice
For this graph functions worksheet, learners complete several activities to help them graph functions. Students use the table and the graph to complete the questions. Learners also answer two test prep questions.
Curated OER
Reading Points on a Graph
In this reading points on a graph learning exercise, students read and identify points on a coordinate plane. They place their answers in the form of an ordered pair. Students identify 20 points. They may enter their answers on the...
Curated OER
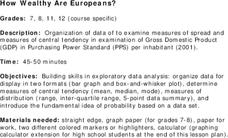
How Wealthy Are Europeans?
Students investigate measures of central tendency. They examine compiled data and conduct critical analysis. The graph is focusing on the gross domestic product data. The lesson also reviews the concept of putting values in order of...
Curated OER
Wing Specifications
Ninth graders use FoilSim to fulfill the specifications of a given airfoil (wing) and plot and interpret graphs.


