Curated OER
Solar Kit Lesson # 12 - Calibration Curve for a Radiation Meter
Scientists need to have mastered algebraic slope-intercept concepts in order for this lesson to be effective. They will measure and graph solar panel output as a function of the amount of radiation striking it, discovering that there is...
Curated OER
Pyrethroid Panic?
Future public health officials read about the exposure to pyrethroid pesticides and analyze box plots of pesticide use, diet, and children's ages. They discuss whether or not there are any relationships in the data. If you feel this...
Curated OER
Plotting the Ocean Floor
Fourth graders plot points on a graph, connect the dots to make the ocean floor profile and label the topographical features. They utilize a worksheet and a website imbedded in this plan to plot the ocean floor.
Texas Instruments
Light and Day
Pupils explore the concept of collecting data as they collect data on their graphing calculator about time, temperature, and light. Learners plot the data and create histograms and box and whisker plots to analyze the data.
Curated OER
Plot Your Course
Students determine distance and direction on a nautical chart. In this nautical lesson, students identify obstacles and characteristics of common aid to navigation on a nautical chart.
Curated OER
How's The Weather?
Students make a box and whiskers plot using the TI-73 graphing calculator. Each student would have their own calculator but they would work in small groups of two or three to help each other enter the data and make the plots.
Curated OER
Get a Half-Life!: Student Worksheet
In this math/science worksheet, students will work in pairs to conduct an experiment based on a decay function which is often used to model radioactive decay. Students will shake M & M's in a cup to rub off the M and then record...
Curated OER
Using a Statistical Procedure To Search A Database For Out of the Ordinary Values
Students develop a spreadsheet containing formulas and find summaries for them. For this investigative lesson students choose a topic, investigate it and use MS Excel to sort data.
Curated OER
LAND USE ISSUES
Students relate math with real life situations. They identify and plot points on a grid map. They identify and locate the Drop Box Sites.
Curated OER
Biological and Agricultural Engineering
Eighth graders explore mathematics by conducting a series of investigations using a colorimeter. In this math lesson, 8th graders explain the purpose of food irradiation. They collect data and graph them.
Curated OER
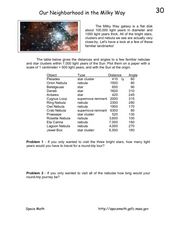
Our Neighborhood in the Milky Way
In this Milky Way galaxy worksheet, students are given a table of distances and angles of nebulae and star clusters from the sun. Students plot each one on a piece of paper and solve 2 problems using the data.
Curated OER
Ornithology and Real World Science
Double click that mouse because you just found an amazing instructional activity! This cross-curricular Ornithology instructional activity incorporates literature, writing, reading informational text, data collection, scientific inquiry,...
Curated OER
Sonar Mapping
Students use a shoe box to create a seafloor model and use cardboard for layering inside of the shoe box to simulate the ocean floor. They probe the ocean floor to simulate sonar echoes. Finally, students graph their data to get a...
Curated OER
Slip Slide'n Away
Young scholars analyze the sliding of boxes along a warehouse floor. In this algebra lesson, students connect math and physics by calculating the friction created by the sliding of each box. They develop faster method to move the box,...
Discovery Education
Sonar & Echolocation
A well-designed, comprehensive, and attractive slide show supports direct instruction on how sonar and echolocation work. Contained within the slides are links to interactive websites and instructions for using apps on a mobile device to...
Curated OER
Teaching Radioactive Decay: Radioactive Half-life And Dating Techniques
Students generate a radioactive decay table for an imaginary element using a box filled with pinto beans and M&M's. They use their data to plot a decay graph, develop the concept of half-life, and use the graph to "age" several samples.
American Museum of Natural History
Trip Up Your Brain
Sometimes different parts of the brain disagree. See what this disagreement looks like using a remote learning resource to experience how brains often take shortcuts. Pupils complete the activity, observe their results, and then read...
Curated OER
Get a Half-life!
High schoolers explore decay functions and the half-life of a substance. Through an M&M activity with calculators, students collect and graph data. They determine the linear, quadratic and exponential functions of the graph. High...
Curated OER
Different Perspectives of Oregon's Forest Economic Geography
Students map data on employment in wood products manufacturing in Oregon counties. In this Oregon forest instructional activity, students discover the percentage of people employed in the forest manufacturing industry. Students create a...
Curated OER
A Place In Space
Students work together to create a 3D coordinate system. They plot points that are given to them and asked to find these points in space. They discover how engineers use coordinates in their careers.
Curated OER
Wing Specifications
Ninth graders use FoilSim to fulfill the specifications of a given airfoil (wing) and plot and interpret graphs.
Curated OER
MOBILITY, Traveling Lightly: What’s My Footprint?
Students calculate their carbon footprint. In this environmental technology lesson, students listen to a lecture on climate change. Students brainstorm solutions to reduce environmental impact based on travel options. Students calculate...
Curated OER
Environmental Mathematics
Eighth graders determine food that they would need to survive in the wild. They graph the best foods for their environments and rate the survivability rate for each member of their group.
Curated OER
What Do Bread and Beer Have in Common?
Students listen to an explanation of yeast cells and how they effect bread and beer. They discuss the ways alcohol affects the human body and participate in an indirect observation about cell respiration in yeast-molasses cultures.


