Hi, what do you want to do?
ReadWriteThink
Read Write Think: Using Picture Books to Teach Plot Development and Confict Res.
Students read picture books to explore the concepts of plot development and conflict resolution. They first learn about the connections between reading and writing, and then revise their own writing. CCSS.ELA-Literacy.CCRA.R.4
Houghton Mifflin Harcourt
Holt, Rinehart and Winston: Homework Help Independent Practice: Scatter Plots
Get independent practice working with scatter plots. Each incorrect response gets a text box explanation and another try. Correct responses are confirmed.
McGraw Hill
Glencoe: Self Check Quizzes 2 Box and Whisker Plots
Use Glencoe's Math Course 2 randomly generated self-checking quiz to test your knowledge of Box-and-Whisker Plots. Each question has a "Hint" link to help. Choose the correct answer for each problem. At the bottom of the page click the...
Shodor Education Foundation
Shodor Interactivate: Lesson: Stem and Leaf Plots
Lesson plan introduces students to stem-and-leaf plots. Many resources are available for student and teachers here.
Other
Nearpod: Introduction to Data Representation
In this lesson on representation data, students explore how to make dot plots, histograms, and box plots and learn about outliers in a data set.
Texas Instruments
Texas Instruments: Comparing Distributions of Univariate Data
Students compare univariate data distributions using statistical concepts like box plots, stem plots, and histograms.
National Council of Teachers of Mathematics
Nctm: Illuminations: Advanced Data Grapher
The Advanced Data Grapher can be used to analyze data with box plots, bubble graphs, scatterplots, histograms, and stem-and-leaf plots.
Texas Instruments
Texas Instruments: Measure Up
In this activity, students compare their height with the average height of students in the class. They create histograms to analyze the data, and construct box plots to summarize the height statistics.
CK-12 Foundation
Ck 12: Statistics: Effects on Box and Whisker Plots
[Free Registration/Login may be required to access all resource tools.] This Concept covers the effects of outliers and a change in units on box-and-whisker plots.
CK-12 Foundation
Ck 12: Statistics: Box and Whisker Plots Grade 8
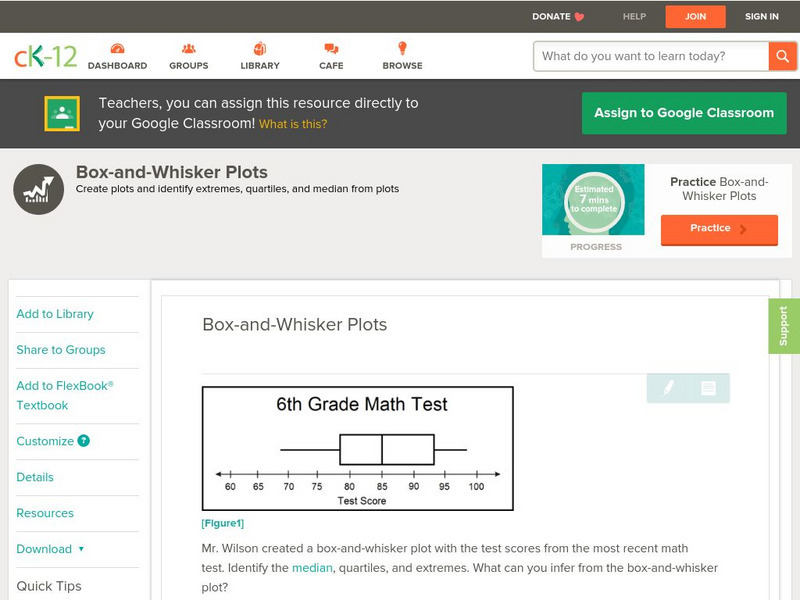
[Free Registration/Login may be required to access all resource tools.] Make Box-and-Whisker Plots to represent data.
CK-12 Foundation
Ck 12: Statistics: Box and Whisker Plots Grades 8 9
[Free Registration/Login may be required to access all resource tools.] Learn how to use box-and-whisker plots to analyze data.
CK-12 Foundation
Ck 12: Statistics: Box and Whisker Plots Grade 7
[Free Registration/Login may be required to access all resource tools.] Draw and use box-and-whisker plots to display and organize data.
CK-12 Foundation
Ck 12: Statistics: Double Box and Whisker Plots Grades 9 10
[Free Registration/Login may be required to access all resource tools.] Construct and use double box-and-whisker plots.
CK-12 Foundation
Ck 12: Statistics: Box and Whisker Plots Grades 9 10
[Free Registration/Login may be required to access all resource tools.] Make and interpret a box-and-whisker plot for a set of data.
CK-12 Foundation
Ck 12: Applications of Box and Whisker Plots Grades 9 10
[Free Registration/Login may be required to access all resource tools.] Use calculators to create box-and-whisker plots.
CK-12 Foundation
Ck 12: Statistics: Applications of Box and Whisker Plots Grade 8
[Free Registration/Login may be required to access all resource tools.] Using box-and-whisker plots to understand and interpret data.
CK-12 Foundation
Ck 12: Statistics: Box and Whisker Plots Grades 11 12
[Free Registration/Login may be required to access all resource tools.] This Concept teaches students how to use the five-number summary to make a box-and-whisker plot.
CK-12 Foundation
Ck 12: Statistics: Box and Whisker Plots Grade 6
[Free Registration/Login may be required to access all resource tools.] Draw and analyze a box-and-whisker plot.
Quia
Ixl Learning: Box and Whisker Plots
Brush up on your math skills relating to box and whisker plots then try some practice problems to test your understanding.
Sophia Learning
Sophia: Box and Whisker Plots
Explore how to display data using a box and whisker plot.
Illustrative Mathematics
Illustrative Mathematics: S id.a.3 Identifying Outliers
In this task, learners are asked to construct a box plot of the distances they live from school and describe the main features of the distribution. The purpose of this task is to develop students' understanding of how extreme data points...
Shmoop University
Shmoop: Basic Statistics & Probability: Box & Whisker Plots
Students learn about box and whisker plots. Notes, examples, and practice exercises are included in the statistics resource.
McGraw Hill
Glencoe Mathematics: Online Study Tools: Box and Whisker Plots
This site gives a short interactive quiz which allows students to self-assess their understanding of the concept of box-and-whisker plots.
Houghton Mifflin Harcourt
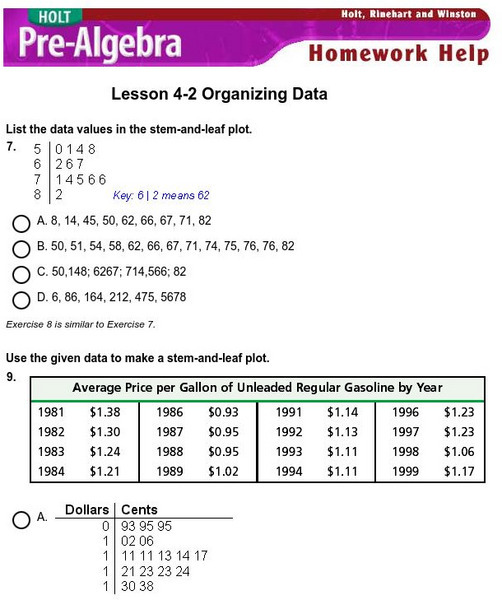
Holt, Rinehart and Winston: Homework Help Independent Practice: Stem and Leaf Plot
Get independent practice organizing data and using stem-and-leaf plots. Each incorrect response gets a text box explanation and another try. Correct responses are confirmed.
Other popular searches
- Analyzing Box Plots
- Outliers Box Plots
- Interpret Box Plots
- Graphs Box Plots
- Analysing Box Plots
- Leaf Box Plots
- Statistics Box Plots
- Conclude Box Plots
- Box Plots Worksheets
- Double Box and Whisker Plots
- Scatterplot Box


