Hi, what do you want to do?
Math Aids
Math Aids: Graph Worksheets
Great resource to practice and strengthen math skills pertaining to graphs. Math worksheets are printable, may be customized, and include answer keys.
Texas Education Agency
Texas Gateway: Selecting and Using Representations for Collected Data
[Accessible by TX Educators. Free Registration/Login Required] Given a variety of data (including line plots, line graphs, stem and leaf plots, circle graphs, bar graphs, box and whisker plots, histograms, and Venn diagrams), the student...
Other
Ode: Seventh Grade Achievement Test (Practice Test) [Pdf]
Half-length practice test for the third grade OAT (Ohio Achievement Test). The test includes 17 multiple-choice and 4 open-response questions dealing with topics such as number sense (order of operations, ratios), measurement (metric...
University of South Florida
Fcat: Drops on a Penny: Teacher Notes
Students learn how to create stem-and-leaf diagrams and boxplots by collecting data on the surface tension of water molecules. This hands-on activity using pennies is a great way to learn how to organize data.
Cuemath
Cuemath: Outlier
A comprehensive guide for exploring the topic of outliers with definitions, what is an outlier, how to find outliers using the turkey method and the interquartile range, solved examples, and interactive questions.
Texas Instruments
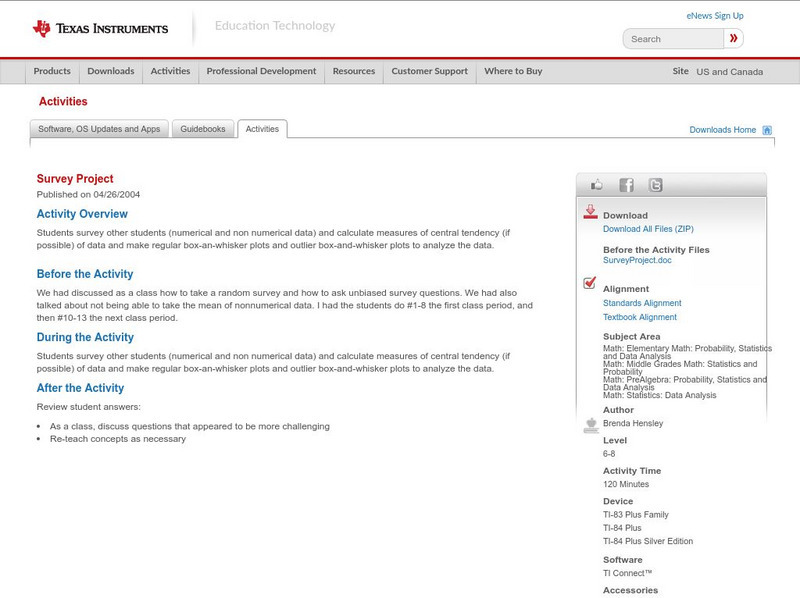
Texas Instruments: Survey Project
Students survey other students (numerical and non numerical data) and calculate measures of central tendency (if possible) of data and make regular box-an-whisker plots and outlier box-and-whisker plots to analyze the data.
Texas Instruments
Texas Instruments: Will Girls and Boys Be Equal?
Students explore concepts in probability and statistics. In this activity, they model a situation to find experimental probability and construct a box-and-whisker plot. They compare the experimental and theoretical probabilities for the...
University of Georgia
University of Georgia: Definitions in Statistics
This site contains definitions to use in statistics and ways to collect data.
Shodor Education Foundation
Shodor Interactivate: Outliers
Explore what outliers are with this interactive activity.
Quia
Ixl Learning: Interquartile Range
Brush up on your math skills relating to interquartile range then try some practice problems to test your understanding.
Mangahigh
Mangahigh: Data: Find the Quartiles and Interquartile Range
This site provides students practice with the concept of interquartile range. Students can learn about the topic by completing an interactive tutorial. Students can then take a ten question timed test to practice the skill.
Khan Academy
Khan Academy: Interpreting Quartiles
Practice understanding the meaning of quartiles of data sets. Students receive immediate feedback and have the opportunity to try questions repeatedly, watch a video or receive hints.
Other popular searches
- Analyzing Box Plots
- Outliers Box Plots
- Interpret Box Plots
- Graphs Box Plots
- Analysing Box Plots
- Leaf Box Plots
- Statistics Box Plots
- Conclude Box Plots
- Box Plots Worksheets
- Double Box and Whisker Plots
- Scatterplot Box


