Texas Instruments
Light and Day
Pupils explore the concept of collecting data as they collect data on their graphing calculator about time, temperature, and light. Learners plot the data and create histograms and box and whisker plots to analyze the data.
Curated OER
Pyrethroid Panic?
Future public health officials read about the exposure to pyrethroid pesticides and analyze box plots of pesticide use, diet, and children's ages. They discuss whether or not there are any relationships in the data. If you feel this...
Curated OER
Using a Statistical Procedure To Search A Database For Out of the Ordinary Values
Students develop a spreadsheet containing formulas and find summaries for them. For this investigative lesson students choose a topic, investigate it and use MS Excel to sort data.
Curated OER
Plotting the Ocean Floor
Fourth graders plot points on a graph, connect the dots to make the ocean floor profile and label the topographical features. They utilize a worksheet and a website imbedded in this plan to plot the ocean floor.
Beyond Benign
Water Bottle Unit
How much plastic do manufacturers use to create water bottles each year? The class explores the number of water bottles used throughout the years to determine how many consumers will use in the future. Class members compare different...
Curated OER
How Old Are the Stars?
Students determine the age of a star cluster by observing, measuring, and plotting astronomical data. They examine the Jewe lbox cluster, located within the southern constellation Crux and determine its age.
Curated OER
Power Metering Project
Young scholars collect and analyze variable data and understand the concept of electrical power. In this energy lesson plan students use a spreadsheet to manage their data and create box plots.
Curated OER
Elastomers: The Best Bungee Cord
Students examine elastomeric polymers in a lab activity in which they design a bungee cord. Students must determine the tensile strength, percent elongation, and plot stress versus strain graphs for their experiments on rubber bands...
Curated OER
Plot Your Course
Students determine distance and direction on a nautical chart. In this nautical lesson, students identify obstacles and characteristics of common aid to navigation on a nautical chart.
Curated OER
How's The Weather?
Students make a box and whiskers plot using the TI-73 graphing calculator. Each student would have their own calculator but they would work in small groups of two or three to help each other enter the data and make the plots.
Curated OER
LAND USE ISSUES
Students relate math with real life situations. They identify and plot points on a grid map. They identify and locate the Drop Box Sites.
Curated OER
Teaching Radioactive Decay: Radioactive Half-life And Dating Techniques
Students generate a radioactive decay table for an imaginary element using a box filled with pinto beans and M&M's. They use their data to plot a decay graph, develop the concept of half-life, and use the graph to "age" several samples.
Curated OER
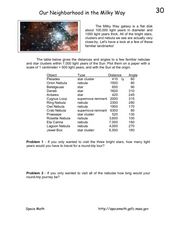
Our Neighborhood in the Milky Way
In this Milky Way galaxy worksheet, students are given a table of distances and angles of nebulae and star clusters from the sun. Students plot each one on a piece of paper and solve 2 problems using the data.
Curated OER
Campus Habitat Improvement Plan
Students work to improve a plot of land. They assess the needs of the environment and formulate a plan. They plant trees and gardens, build bird boxes, construct waterholes. etc.
Curated OER
Wavelength And Resolution
Students perform a simulation of the workings of an electron microscope to discover that the resolution will need to improved to detect objects in the nano-scale. They use wooden dowels as detectors to determine the shape of objects in...
Scholasic
The Magic School Bus and the Missing Tooth
We chew with our teeth every day, but how much do we really know about them? Allow Ms. Frizzle to teach your kids a thing or two about teeth. Kids complete a prereading exercise, read the book, and respond to several prompts about the...
Curated OER
Sonar Mapping
Students use a shoe box to create a seafloor model and use cardboard for layering inside of the shoe box to simulate the ocean floor. They probe the ocean floor to simulate sonar echoes. Finally, students graph their data to get a...
Curated OER
Lesson Design Archaeology
Students participate in their own excavation and measure and record as they go. In this archaeology lesson students divide into groups and solve the mystery of what they uncovered in their dig box.
Curated OER
Different Perspectives of Oregon's Forest Economic Geography
Students map data on employment in wood products manufacturing in Oregon counties. In this Oregon forest instructional activity, students discover the percentage of people employed in the forest manufacturing industry. Students create a...
Curated OER
Slip Slide'n Away
Young scholars analyze the sliding of boxes along a warehouse floor. In this algebra lesson, students connect math and physics by calculating the friction created by the sliding of each box. They develop faster method to move the box,...
Curated OER
A Place In Space
Students work together to create a 3D coordinate system. They plot points that are given to them and asked to find these points in space. They discover how engineers use coordinates in their careers.
Creative Chemistry
Alkanes and Alkenes
In this alkanes activity, students use a data table to plot a graph of boiling point against the number of carbon atoms. They also define cracking and double bonds. This activity has five short answer questions.
American Museum of Natural History
Trip Up Your Brain
Sometimes different parts of the brain disagree. See what this disagreement looks like using a remote learning resource to experience how brains often take shortcuts. Pupils complete the activity, observe their results, and then read...
Curated OER
Secrets of the Ocean Realm - In the School "Star Gardens"
Students learn to use a tide table in plotting tidal curves and create a tide calendar by plotting a month-long tidal curve on an ordinary pictorial calendar.
Other popular searches
- Analyzing Box Plots
- Outliers Box Plots
- Interpret Box Plots
- Graphs Box Plots
- Analysing Box Plots
- Leaf Box Plots
- Statistics Box Plots
- Conclude Box Plots
- Box Plots Worksheets
- Double Box and Whisker Plots
- Scatterplot Box


