Curated OER
Measuring the Volume of Water Discharge for a Stream or Canal
Students study how to measure and calculate the volume of water flowing down a stream or canal and use simple tools to make measurements. Next, students determine how many people cold live off the volume of water measured. Finally, they...
Curated OER
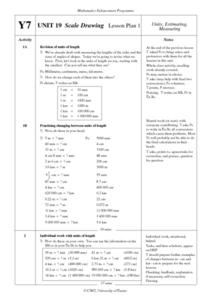
Scale Drawing Lesson Plan
Learners calculate actual building measurements from a village map using concepts of ratios and scale in this ten lesson mini-unit. They practice measuring angles, multiplying decimals, estimating height and length, and converting metric...
Curated OER
Louisville's Best Field Day Park
Students create a survey to hand out to determine the best field day park. Using their local area, they select five parks, if possible, that meet the criteria and calculate the distance and estimated time travel. They use this...
Curated OER
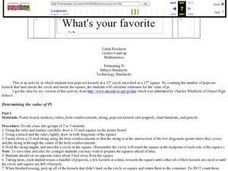
What's your favorite pi?
Sixth graders toss popcorn kernels at a 12? circle inscribed in a 12? square. By counting the number of popcorn kernels that land inside the circle and inside the square the students calculate estimates for the value of pi.
Curated OER
Forestry and Forestry Products
High school and college learners identify forestry career opportunities. They identify the parts of a tree cross-section and trees based on their leaves and characteristics. Pupils calculate board feet and explain safe methods of...
Curated OER
In Round Numbers
Students explore the concept of rounding. In this rounding lesson, students use their calculator to round three digit numbers to the nearest 10 or nearest 100. Students round fractional numbers to the nearest tenth, hundreth, and...
Curated OER
How Many Units?
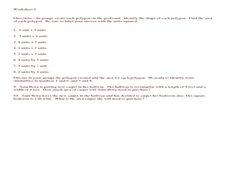
Young mathematicians calculate the area of rectangles and squares. In this geometry lesson, learners are grouped in pairs and use geoboards to construct rectangles. They calculate the area of the figure by counting the number of square...
Curated OER
See Turtles Nest! See Turtles Hatch!
Students graph data of sea turtles hatching rates from Watamu/Malindi Marine National Park and Reserve in Kenya. In this math lesson, students use real life science data to calculate mean and median values. Students use the data to...
Curated OER
Off to College
High schoolers investigate linear, quadratic and exponential equations using the TI calculator. They identify relation and functions using ordered pairs, graph the data, analyze the data, and relate it to real-world situations.
Curated OER
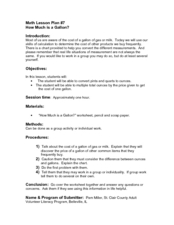
How Much Is A Gallon?
By engaging in real life examples, learners practice measurement and conversion skills. They review a chart comparing pints, quarts, and gallons. Then, they complete a worksheet involving prices per unit. For example, they calculate how...
Curated OER
Coconut and Chocolate Chip Passover Macaroons
Recipies are a natural medium for using fractions in real-world problems. This delicious activity has learners adapting the ingredients for coconut and chocolate chip macaroons, a Passover treat, for fewer and more cookies than the...
Curated OER
How Do You Get to School?
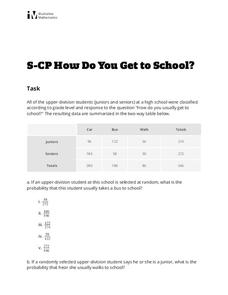
Looking for a short assessment on probability? Learners use a two-way table to calculate a probability and a conditional probability. Multiple choice answers could be eliminated to create a short-answer activity for your class. There are...
Curated OER
Slope & Rate of Change
This short handout addresses the concept of slope in two different ways: geometrically and analytically. Start with a brief description of slope, then use graphical representations to compare positive vs. negative slope and zero vs....
Illustrative Mathematics
Graphs of Power Functions
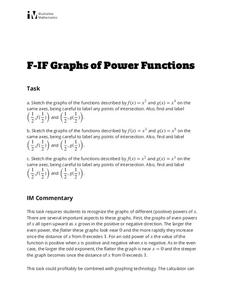
This activity consists of three exercises in which learners sketch the graphs of various power functions on the same axes. They use their sketches to make comparisons and observations which lead to generalizations about the graphs of...
Virginia Department of Education
Transformation Investigation
Graph it! Investigate transformations with a graphing calculator. Pupils graph sets of linear functions on the same set of axes. They determine how changes in the equation of a linear function result in changes in the graph.
Curated OER
New Angle on Forest Ecology
Students measure and calculate the angle of the sun. They compare the leaf types on the north and south to compare the effects of the sun on the type of vegetation. They complete the activities inside the classroom or on a trip to a...
Curated OER
Financial Contracts
Prepare your class for the real world and learn the basics about credit and the principles behind using it wisely. The activity includes handouts that explain the necessary vocabulary and concepts to understanding credit. After reviewing...
Curated OER
Weaving a Story
It's time to investigate patterns! First and second graders construct a paper weaving using a hundreds chart, then use the Ti-10 calculator to make patterns such as adding 3 each time. Learners remove multiples of three from the hundreds...
Curated OER
Water Usage Guidelines
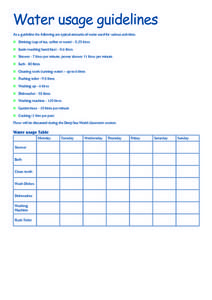
In this environmental awareness and math worksheet, students calculate their total water use in a week. Students first read a chart which lists the amount of water (in litres) used for 15 activities. Students write the number of litres...
Curated OER
Baseball Math
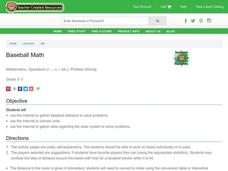
Fifth graders complete activity pages. In this operations and problem solving activity, 5th graders use the Internet to gather baseball statistics, solve problems and convert units.
Curated OER
Equations from Unit Rates
Your class can become linear equations masters, as they calculate the rate of change of a function. They observe different types of coordinates as they relate to a graph, then use the Ti-navigator to move the line around and draw...
Curated OER
Reading Graphs with a Logarithmic Scale
Guide high school meteorologists through a detailed examination of oxygen concentration data. The learners analyze a line graph containing logarithmic data and employ the use of a graphing calculator. A comprehensive worksheet and links...
Curated OER
Why Doesn't My New Shirt Fit?
Pupils test Leonardo da Vinci's view of the human body by measuring various body parts using a tape measure. They create a data table and a scatter plot and then analyze and interpret the results using a graphing calculator.
Curated OER
What's in a Graph?
Students explore how to use and interpret graphs. The graphs are pulled from a variety of sources, and the activities ask students to interpret graphs. They start this lesson with knowledge of what a graph is. Students also know how to...


