Curated OER
Birds, Fractions and Percentages
Students study fractions, percentages, spreadsheets, and computers by watching and recording the number of species of birdsseen. They create a spreadsheet to record the results of their one month study.
Curated OER
Math in the Wetlands Field Trip
Get your class out in the environment for hands on math activities. In this wetlands lesson, learners transplant native plants, calculate how much soil is needed, and perform math activities based on this experience. They then make...
Curated OER
Math in Science-Rain Forest Math
In this rain forest instructional activity, students use different basic math skills to calculate the percentage of Earth covered by rain forests today compared to fifty years ago. They study the effects of how cutting down trees...
Curated OER
Coal Supply and Demand
A hands-on simulation perfect for an economics instructional activity, young learners investigate the availability of different sources of natural energy (coal, natural gas, oil, solar, and nuclear) and how this availability affects...
Curated OER
Real Math
Students explore careers that require math knowledge and solve real life math problems. As a class, they compare and contrast classroom math to real life math and explore the links between algebra, geometry and math skills used in...
Curated OER
How Much Ocean?
In this ocean worksheet, students are given a map of the world and they predict the amount of water that covers the Earth's surface. They count the total number of squares on the given map that represent the water and they land and they...
Curated OER
"Water is Life" Global Water Awareness
Young scholars examine and calculate the percentage of potable water remaining on the earth. In this ecology and geography lesson, students brainstorm the main factors affecting water distribution. Young scholars use mathematical problem...
Curated OER
It Has Been Rubbish For Years
Students are presented with the problems of percentages and focus upon numbers in contrast to 100. They calculate problems with money and are engaged with the use of games as a teaching tool. Students also interpret data as presented in...
Curated OER
Our Solar System - Comparing Planetary Travel Distances
NASA presents a mini-unit on distances in our solar system. It incorporates scientific concepts of gravity, mass, density, and payload while your aspiring astronauts also employ mathematics skills. They calculate speed, they determine...
Beyond Benign
Truckin’ to Your Table
Food takes a trip to the table. Class members choose a meal from a menu and calculate the total cost of the meal including tax and tip. Using a food origin card, pupils determine how far each of the ingredients of a meal traveled to end...
Curated OER
Hybrid Vehicles: Cut Pollution and Save Money
Math and science meet in this lesson on hybrid electric automobiles. This 24-page resource provides everything you need for teaching a lesson that compares the use of internal combustion engines to hybrid electric engines. Participants...
Curated OER
Explore Surface Types on a Journey Around Earth
Students explore satellite data. In this technology cross-curriculum math and world geography instructional activity, students locate specific map areas using a microset of satellite data. Students use technology and math skills to...
Curated OER
Making Blood!
students research blood's components, and use their math skills to recreate a model of whole blood using commonly found food items.
Curated OER
Compound Interest
In this compound interest activity, students solve 3 problems after reading about compound interest. They determine the cost of the Apollo missions, they calculate inflation and the cost it would be to send man to the moon today and they...
Curated OER
Pen Light Lab
Young scholars study what makes Earth warm and explore how different locations on the planetreceive different amounts of solar energy based on the intensity of the sun's rays. They calculate light intensities and compare the
amounts of...
Curated OER
Seeing a Dwarf Planet Clearly: Pluto
In this dwarf planet worksheet, students use images from the Hubble Space Telescope and they determine the scale of the image, they identify the largest features in the images, they calculate the volume of Pluto and they create a model...
Curated OER
When the Snow is as High as an Elephant
High schoolers study the concept of mean values using a data plot. Learners enter the given data in the activity to create their data table. They use the data table to calculate the mean of the snowfall percentage provided in the...
Curated OER
The Atmosphere
Students calculate the percentage of oxygen in the atmosphere. They create a semi-scale drawing of the atmosphere.
Curated OER
Introduction to Measuring the Forest
Students investigate how much wood is in a forest. For this forestry lesson, students calculate how much usable wood comes from the forest. They will read, Sizing Things Up from Trees + Me = Forestry, measure firewood piles, and create a...
Curated OER
Comparing Earth and Mars
Learners work together to compare and contrast Mars and Earth. Using the internet, they answer questions given to them by their teacher and calculate answers showing their work. They graph their answers and discuss the results of the...
Curated OER
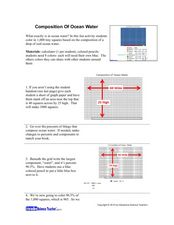
Composition of Ocean Water
Learners experiment to determine the composition of ocean water. In this ocean water composition lesson, students color in a grid that shows the percentage of each of the components of ocean water which include chloride, sodium, sulfate,...
Curated OER
Watt Power
Students discuss the concept of power and the meaning of watts. In this experimental lesson students divide into groups, record data and calculate the results.
Curated OER
Bubble Gum Chemistry
Students explore the concept of graphing data. In this graphing data instructional activity, students determine the percentage of sugar in bubble gum. Students graph type of gum vs. sugar percentage. Students create a table of their data.
Science Geek
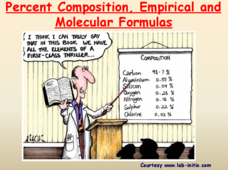
Percent Composition, Empirical and Molecular Formulas
Help your pupils understand when empirical becomes molecular. The lesson presentation demonstrates the connection between empirical formulas and molecular formulas. Then, given percent composition, the lesson demonstrates the steps to...

