Curated OER
Build a Skittles Graph
Students construct a bar graph with a given set of data. They calculate the ratio and percent of the data. Students discuss alternate ways of graphing the data as well as multiple strategies to approach the task.
Curated OER
Our Favourite Halloween Treat
Students conduct a survey about Halloween candy and create a bar graph illustrating the data. In this data analysis lesson, stud nets are introduced to the topic with a discussion and survey, then the class creates a large graph and...
Curated OER
Graphing
Young scholars investigate graphing. In this bar graph lesson, students view an informational website about graphing, then construct a class birthday bar graph outside with sidewalk chalk. Young scholars choose a survey topic, then...
Curated OER
Technobiz
Students examine candy preferences to create a plan in order to improve candy sales. In this technobiz lesson, students build spreadsheet and organizational skills by graphing and calculating data. Students are introduced to terminology...
Curated OER
Fractions - Equal or Not
A fabulous lesson on fractions awaits your young mathematicians. In it, learners are invited to explore the world of fractions by accessing websites that have educational activities and worksheets embedded in them. Some excellent,...
Beacon Learning Center
Twix-n-Tween
Yummy! Use Twix candy bars to teach a instructional activity in comparing length! Learners will love this instructional activity and you will be addressing Common Core standards at the same time!
Curated OER
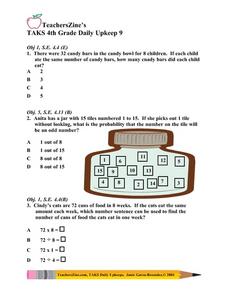
Daily Upkeep 9
For this math worksheet, 4th graders complete a set of word problems where they solve to find the difference number of candy bars. Then, they look at a jar with number tiles and select the probability that the number on the tile will be...
Curated OER
Organizing And Reading Data
Students complete three parts of an "Organizning and Reading Data" worksheet. First, they go over the rubric to determine the work will be scored. They organize data by taking tallies, make a pictograph and a bar graph using the data....
Curated OER
Skittles, Taste the Rainbow
Fifth graders learn and then demonstrate their knowledge of a bar and a circle graph using the classroom data. Students are given a pack of skittles candy. Students create a bar and circle graph indicating the results of the contents of...
Curated OER
M&M Caper
Students participate in a game with M&M's to be introduced to percents and ratios. Individually, they estimate and record the number of candies they believe the bag holds and the amount of each colored candy. They open the bag and...
Curated OER
Bananas! Bubble Gum! Which One?
Students design and create a graph of data they have collected on their favorite candy bars. They explore how to organize data as well.
Curated OER
Graphing
Fifth graders practice using math graphs. In this graphing lesson, 5th graders work in groups to develop a topic of their own to represent as a graph. Students collect data and construct a graph for the lesson.
Curated OER
Fair Shares and Geometric Spirals
Students tackle the problem of how to divide a triangular piece of land fairly among four people. They decide whether their method of fair division always works or if it only works in special cases.
Curated OER
The Pythagorean Puzzle
An engaging hands-on activity is presented. Learners of all ages are addressed in thie unique plan. K-5 learners identify, name, and define a rectangle, square, triangle, and the concept of area. Older learners prove the Pythagorean...
Curated OER
Flavorful Spreadsheets
Learners create a spreadsheet which includes a bar graph. They sort and classify information and use the average function on a spreadsheet. They research Skittles candy and summarize their findings on a spreadsheet.
Curated OER
Surveying During a Basketball Game
Tenth graders conduct a survey at a high school basketball game. They compile and present the data as histograms or bar graphs.
Curated OER
The Statistics of M&Ms
Students explore the topic of statistics with M and Ms. For this math lesson plan, students use candy pieces to sort and gather information needed to create a bar graph. This lesson can be adapted to accommodate students in grades 1-12.
Curated OER
Skittle Graphing (Lesson Plan)
Students discuss the uses of graphs. They use color candies to count and sort before designing graphs. They label the graph papers with appropriate titles and candy colors. They complete the graph bars, and discuss the results with a...
Curated OER
Fraction Fun With Food
Students use candy and pizza to identify concepts associated with fractions. They work together in groups to create fractions. They complete a worksheet individually to complete the activity.
Curated OER
Halloween Graphitti
Students complete multi-curricular activities in a Halloween themed lesson. In this Halloween lesson, students examine newspaper ads to find prices of pumpkins and use them to complete a stem and leaf plot. Students find the diameter,...
Curated OER
China: Dim Sum: A Mars Bar Fraction Hunt Lesson
Students practice in the use of fractions, changing fractions, using equivalent fractions and paying attention to detail.
Curated OER
Using Spreadsheets and Graphs
Third graders explore mathematics by utilizing computers. In this graphing lesson, 3rd graders gather class data based on a particular topic such as the "favorite candy" of the class. Students utilize this information and computers to...
Curated OER
"How Many Names for 100?"
Fifth graders work on the different possibilities of reaching the number 100. The class is divided into homogeneous groups for cooperative learning. The lesson uses discussion questions to help with problem solving.
Curated OER
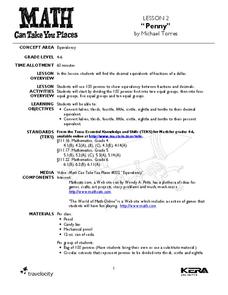
Penny
Students explore the concept of equivalency. In this equivalents lesson, students use pennies to show equivalency as they divide them into groups. Students also convert the pencils into decimals and fractions.


