Curated OER
Worksheet 19: Ship Positions
In this math worksheet, students read informational paragraphs and then answer 18 questions using data from their readings. Questions are about vectors, positions, distance and orbits.
Curated OER
Estimating the Mean State Area
Seventh grade statisticians randomly select five states and then determine the mean area. The class then works together to create a dot plot of their results.
Curated OER
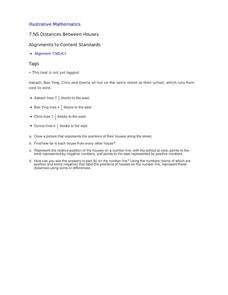
Distances Between Houses
This resource sneaks in the math so your learners will be adding and subtracting positive and negatives on a number line while thinking they are mapping out houses. The activity starts by putting houses the appropriate distance away from...
Illustrative Mathematics
Bank Shot
Young geometers become pool sharks in this analysis of the angles and lengths of a trick shot. By using angles of incidence and reflection to develop similar triangles, learners plan the exact placement of balls to make the shot....
Curated OER
Applying the Pythagorean Theorem to find Distances Between Cities
Young scholars solve problems using the Pythagorean Theorem. In this geometry instructional activity, students identify the Pythagorean Triple and use it to solve real life problems.
EngageNY
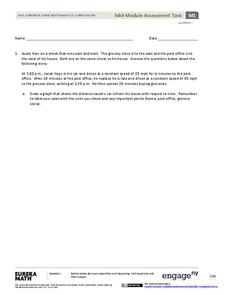
Mid-Module Assessment Task - Algebra 1 (module 1)
Looking for performance tasks to incorporate into your units? With its flexibility, this resource is sure to fit your teaching needs. Use this module as a complete assessment of graphing linear scenarios and polynomial operations, or...
Curated OER
Separate Vacations
Young scholars plot the migration paths of birds using latitude and longitude data from a table.
Curated OER
Data-gathering Activities Relating to Trees in Their Environment
Students gather data relating to trees in their environment. In this biology lesson plan, students determine heights of trees and their ages. A canopy map will indicate optimal growing areas for the tree.
Curated OER
Order Numbers On a Number Line
Fifth and sixth graders study the use of a number line to add integers and they observe a teacher demonstration of how to add integers on a number line. Afterward, they construct a number line and use the number line to solve addition...
Curated OER
Mapping a Site Using a Coordinate Plane
Learners map their playground as if it were an archeological site. They locate objects on the playground and determine their location using coordinate points. A related lesson plan is Coordinate Grid: Mapping an Archeological Site.
Curated OER
Shapes (Orienteering)
Learners explore the tools of navigation. In this shapes activity, students navigate using direction cues to create a shape. Learners follow specific steps to create their shapes. Students use compasses to see the directions they are...
Curated OER
Lesson 6-7: Scatter Plots and Equations of Lines
In this scatter plot worksheet, students examine tables and write a linear equation that matches the table. Students graph linear equations. They read scatter plots, determine the trend line, and write a linear equation to match...
Curated OER
Using Math To Make Decisions About Animal Habitat
In this animal habitat worksheet, students read, analyze and solve 5 scenarios involving mathematics and animal habitats. Students work out each decision they decide as correct and write out a proposal for each one.
Curated OER
Right Triangle Trigonometry
In this trig activity, 12th graders identify the angles of a tight triangle using sine, cos and tan combined with the given sides. There are 23 problems broken down in 4 sections.
Curated OER
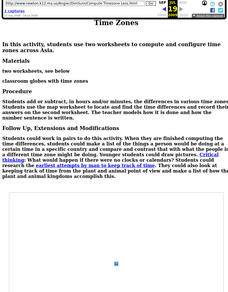
Time Zones
Fifth graders locate different time zones. In this time zones lesson, 5th graders label the different time zones. Students research the different ways man has kept time throughout history. Students also compute the differences in time...
Curated OER
Interpreting Line Graphs
Fifth graders interpret line graphs. In this graphing instructional activity, 5th graders first begin by reviewing the difference in bar and line graphs and what they are used for. Students practice interpreting the data on various line...
Curated OER
Angles and Turns
For this angles worksheet, students solve 24 problems in which angles and measurements on a compass are calculated. There are also some map problems to solve. The page is intended for online use but can be done on paper.
Curated OER
Longitude
In this globe worksheet, students learn how longitude is measured on a globe. Students read the information before answering 5 questions. A globe will be required.
Curated OER
Map Scale and the Pioneer Journey
Fourth graders, using a map, ruler and calculator, determine the distance the pioneers traveled from Nauvoo, Ill. to the Salt Lake Valley.
Curated OER
The Right Angle
In this algebra worksheet, students rewrite word problems using an algebraic equation to find the answer. There are 14 questions with an answer key.
Curated OER
Practicing Pythagoras
In this math worksheet, students practice answering the questions for finding the hypotenuse of the given triangles while using the Pythagorean Theorem.
Curated OER
Where in the World Am I: Latitude And Longitude
Pupils demonstrate their knowledge in using latitude and longitude measurements to find locations on a map, especially places in Hawaii.
Curated OER
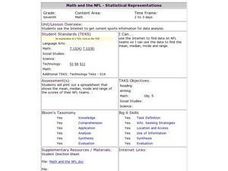
Math and the NFL - Statistical Representations
Seventh graders use the Internet to get current sports information for data analysis. They use their data to find the mean, median, mode and range. Students then place their data on a spreadsheet.
Curated OER
Graphing Systems of Equations - Word Problemsr
Pupils solve word problems which involve graphing systems of equations. After discussing methods of solving word problems, the teacher demonstrates how to solve problems which involve graphing. They work together, at their desks, and...
Other popular searches
- Four Cardinal Points
- Teaching Cardinal Points
- Cardinal Points Worksheets
- Inter Cardinal Points
- The Cardinal Points


