Science Education Resource Center at Carleton College
Serc: Measuring and Graphing Toy Water Animal Growth
Lesson involves scientific investigation and knowledge of units of measurement. Students will select and submerge a growing water animal toy, predicting and measuring its growth of at least three places of metric measurement of distance...
Shodor Education Foundation
Shodor Interactivate: Data Flyer
Enter a set of data points, then derive a function to fit those points. Manipulate the function on a coordinate plane using slider bars. Learn how each constant and coefficient affects the resulting graph.
Channel 4 Learning
Channel 4 Maths: Mathszone
Can you help Ben and Mai escape their captors and foil the robbers' getaway plan? Test your mathematical aptitude in this captivating, interactive, adventure game that uses a PDA/calculator to solve math clues. Students will activate...
Texas Instruments
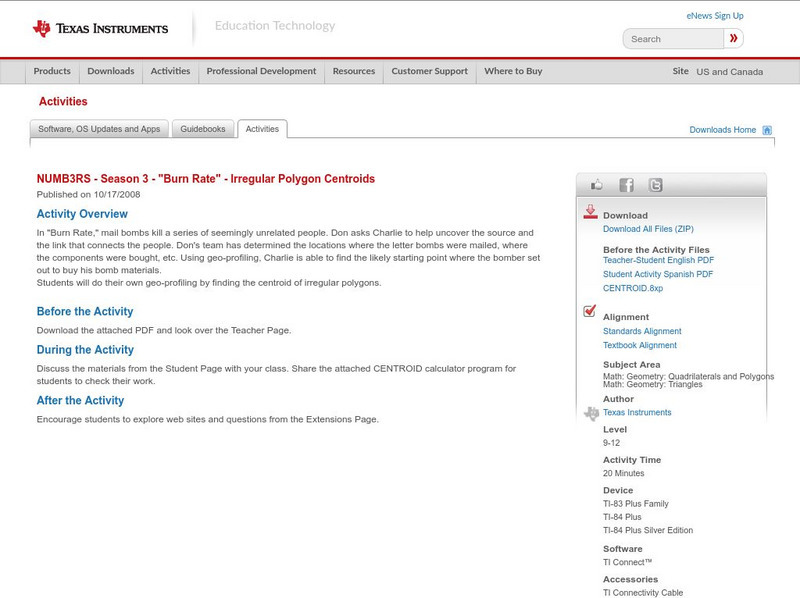
Texas Instruments: Numb3 Rs: Irregular Polygon Centroids
Based off of the hit television show NUMB3RS, this lesson has students explore finding the centroid of an irregular polygon by finding the mean of the coordinates of the polygon's vertices. Further, students find the centroid given that...
Ministry of Education and Universities of the Region of Murcia (Spain)
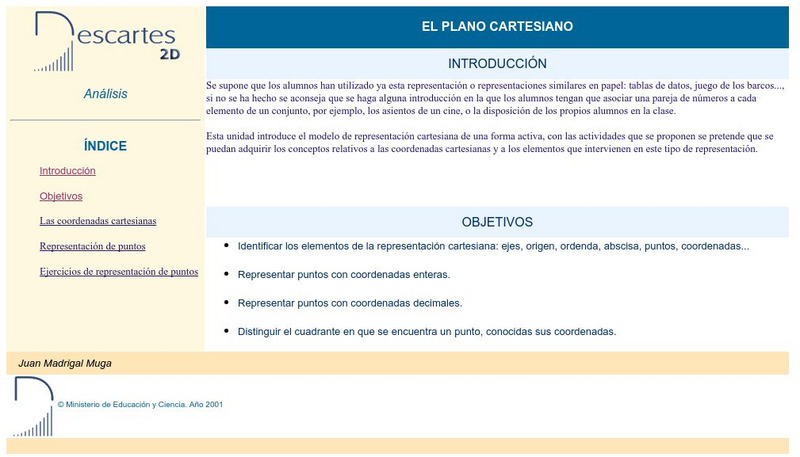
Ministerio De Educacion Y Ciencia: El Plano Cartesino
Interactive activities that will help you plot points on the Cartesian Coordinate Plane.
Shodor Education Foundation
Shodor Interactivate: Interactive: Scatter Plot
Use this interactive applet to input a series of (x, y) ordered pairs and plot them. Parameters such as minimum and maximum value, minimum and maximum y value, and x- and y-scale can be set by the user or determined by the applet.
Shodor Education Foundation
Shodor Interactivate: Scatter Plot
Graph ordered pairs and customize the graph title and axis labels. Points are connected from left to right, rather than being connected in the order they are entered.
Shodor Education Foundation
Shodor Interactivate: Box Plot
Students can create box plots for either built-in or user-specified data as well as experiment with outliers. User may choose to use or not use the median for calculation of interquartile range.
Shodor Education Foundation
Shodor Interactivate: Graph Sketcher
Students can create graphs of functions entered as algebraic expressions similar to a graphing calculator.
Math Open Reference
Math Open Reference: Point
A complete reference guide to points. It provides definitions and an interactive activity that enhances further explanation. Includes links to related topics.
Houghton Mifflin Harcourt
Holt, Rinehart and Winston: Homework Help Independent Practice: Functions
Get independent practice working with functions. Each incorrect response gets a text box explanation and another try. Correct responses are confirmed.
ClassFlow
Class Flow: Perpendicularity
[Free Registration/Login Required] This flipchart looks at perpendicularity. There are two student activities, one with constructing perpendicular lines (student worksheet attached) and the other is the coordinate plane.
Texas Instruments
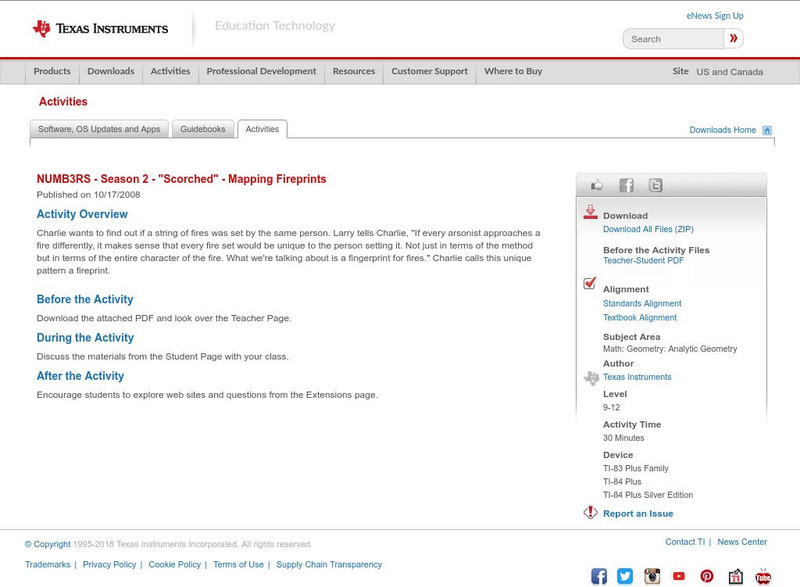
Texas Instruments: Numb3 Rs: Mapping Fireprints
Based off of the hit television show NUMB3RS, this diverse lesson has students perform linear regression analysis (to compare two fire variables), check three-dimensional points using a planar equation, and evaluate points to determine...


