Curated OER
Social Studies: Canadian City Comparison
Young scholars research Canadian population distribution while comparing and contrasting the quality of life in two cities. They discuss issues and problems that cities and rural towns face. Students apply various methods, such as...
Texas Instruments
Texas Instruments: Describing Categorical Data
Students analyze the distribution of categorical data. They calculate percents and visually compare the data sets with a bar chart.
Texas Instruments
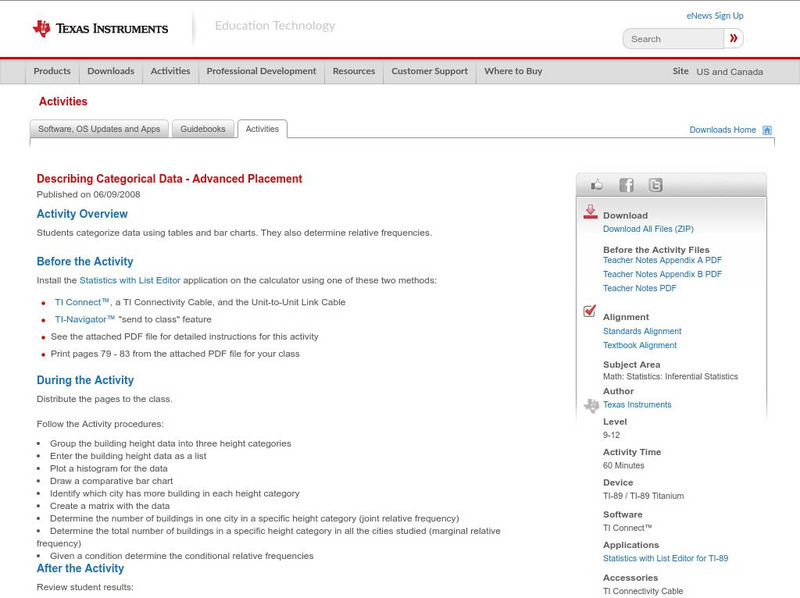
Texas Instruments: Describing Categorical Data Advanced Placement
Students categorize data using tables and bar charts. They also determine relative frequencies.
National Council of Teachers of Mathematics
The Math Forum: Growth Creature Lab Data Collecting
Lesson plan completely explains how students will collect data on the growth of an "alligator" and determine the relationship of the growth data to the Fundamental Theorem of Similarity and to topics in geometry in general. All of the...
Utah Education Network
Uen: Generating and Recording Data
This "fish" activity will help early elementary students develop skills related to categorizing, recording data, developing vocabulary, and counting. An assessment rubric is attached.
Illustrative Mathematics
Illustrative Mathematics: Favorite Ice Cream Flavor
The purpose of this task is for students to represent and interpret categorical data. As a class, students will answer a question with three possible answers and construct a bar graph with the responses. Multiple discussion questions and...
Science Education Resource Center at Carleton College
Serc: Adventures at Dry Creek
This educational module enables students (5-12) to experience ongoing research of University of California paleontologists studying about life in Montana 60-70 million years ago. It gives students the opportunity to experience the...
Climate Literacy
Clean: A Fossil Thermometer
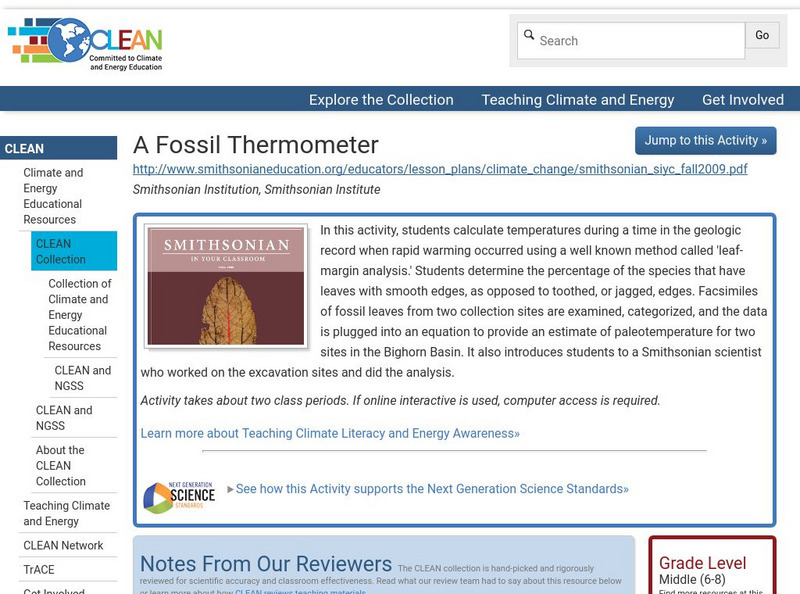
In this activity, students calculate temperatures during a time in the geologic record when rapid warming occurred using a well known method called 'leaf-margin analysis.' Students determine the percentage of the species that have leaves...
Illustrative Mathematics
Illustrative Mathematics: N q.a.3 and S id.a: Accuracy of Carbon 14 Dating I
This task examines, from a mathematical and statistical point of view, how scientists measure the age of organic materials by measuring the ratio of Carbon 14 to Carbon 12. The focus here is on the statistical nature of such dating....
Other popular searches
- Categorical Data Worksheet
- Classify Categorical Data
- Numerical vs. Categorical Data
- Numerical vs Categorical Data


