Hi, what do you want to do?
Curated OER
The Student Newspaper on World War I
Young scholars explore WW I through the publication of a completely student-compiled newspaper.
Curated OER
A Sense of West Virginia
Students consider their perceptions of the world through their 5 senses while visiting the West Virginia State Museum. In this West Virginia history lesson, students discover how knowing about the past helps with their understanding of...
Curated OER
Jeannette
Students develop hypothesis about what might happen when salt water is frozen. In groups, they freeze ice samples with different salt concentrations. They use the internet to research the situation of the Jeannette to discover their...
Curated OER
Tic-Tac-Toe for Layers of the Earth
Eighth graders identify the different layers of the earth. In this earth science lesson, 8th graders choose a project to do from a given list according to their learning style. They present their finished project in class.
Curated OER
Watershed Management
Students investigate the concept of a watershed. They conduct research into the concept using a variety of resources. Students take a field trip to a local watershed to make observations. The outcome is a report concerning the outside...
Intel Corporation
Intel: Seeing Reason: Mind Mapping Cause and Effect
The "Seeing Reason Mapping Tool" is a free online tool that teachers and students can use to foster cause and effect understanding. Teachers must register for free access and set up projects; then their students can use the projects...
University of South Florida
Fcat Express: Cause and Effect Thinking Map
A graphic organizer to help determine cause and effect relationships within a text.
Better Lesson
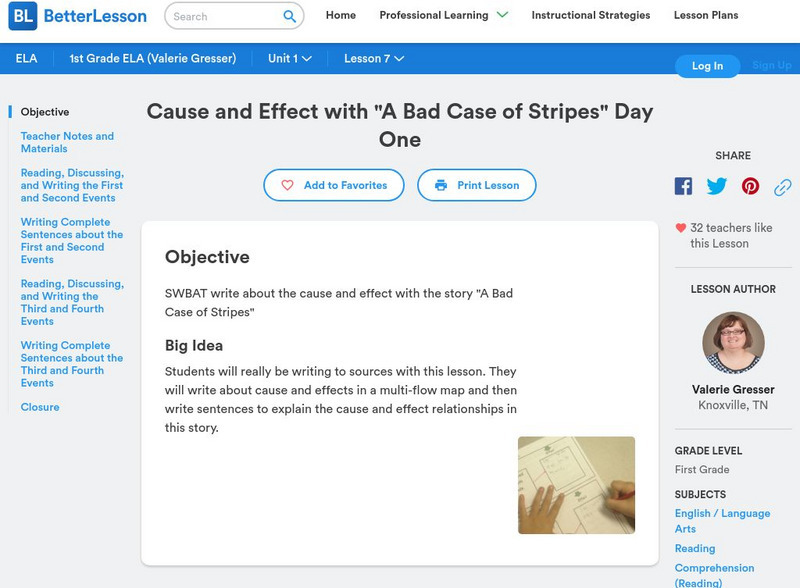
Better Lesson: Cause and Effect With "A Bad Case of Stripes" Day One
Students will really be writing to sources with this lesson. They will write about cause and effects in a multi-flow map and then write sentences to explain the cause and effect relationships in this story.
ClassFlow
Class Flow: Graphic Organizer Map Cause and Effect
[Free Registration/Login Required] This graphic organizer flipchart uses the fishbone technique to map cause and effect. It is useful for helping students understand and analyze reading passages, historical events, and scientific...
Intel Corporation
Intel Education: Seeing Reason Tool
This interactive tool lets students build maps that explain relationships in several ways. Sample lessons using the tool are also available. Free registration is required for use of the Workspace.
Utah Education Network
Uen: Character Mapping
Fifth graders will read a high interest novel and analyze how a character responds to a challenge. Students will reflect on the theme conveyed in the novel, too.
Annenberg Foundation
Annenberg Learner: Journey North: A Global Study of Wildlife Migration and Seasonal Change
Join teachers and students all over the country in observing the migratory patterns of birds and butterflies and the growth changes of plants as the climate changes. "Journey North" offers a wealth of resources to use as you investigate...
E-learning for Kids
E Learning for Kids: Science: Seychelles: Earthquakes and Effects
Students learn about what happens inside the Earth to cause an earthquake, how earthquakes are measured, their impact on the surface, and safety precautions to take during an earthquake.
ClassFlow
Class Flow: Graphic Organizers
[Free Registration/Login Required] This flipchart is a collection of colorful, graphic organizers including cause and effect, Venn diagram, comparison map, web, KWL, problem-solution chart, story web, story map, and sequence chart.
TeachEngineering
Teach Engineering: Air Pollution
Students are introduced to the concept of air quality by investigating the composition, properties, atmospheric layers and everyday importance of air. They explore the sources and effects of visible and invisible air pollution. By...
Daily Teaching Tools
Daily Teaching Tools:more Graphic Organizers for Teaching Literature and Reading
This Daily Teaching Tools collection provides graphic organizers for teaching reading and literature. Elaborate graphic organizers are provided for the following: story maps, character study charts, making text connection maps, conflict...
University of South Florida
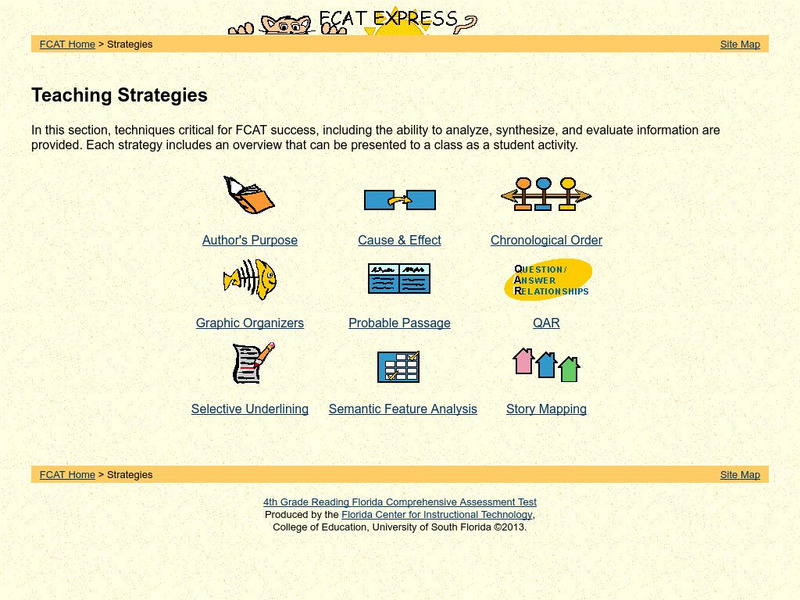
Fcat Reading Grade 4: Teaching Strategies
This is a great resource that concentrates strategies and student activities in one place in an easy to use format, and can be navigated easily. Find great examples of probable passage, selective underlining, and semantic feature...
Columbia University
Scientific Background on the Indian Ocean Earthquake and Tsunami
This site features information and related links that can be used by students and scientists to understand the events that led to the December 2004 Indian Ocean tsunami.
NASA
Nasa Earth Observatory: Mapping Malaria
This article demonstrates how by mapping malaria outbreaks, the local governments would be capable of spraying these houses with insecticides and reducing malaria outbreaks by half. Medical databases and airplane photographs help...
Textbook of Bacteriology
Todar's Online Textbook of Bacteriology: Vibrio Cholerae and Asiatic Cholera
In addition to providing information on the intestinal disease cholera, this article discusses characteristics of the bacterium that causes it, Vibrio cholerae. This website includes a picture of the bacterium, a map of the disease's...
National Endowment for the Humanities
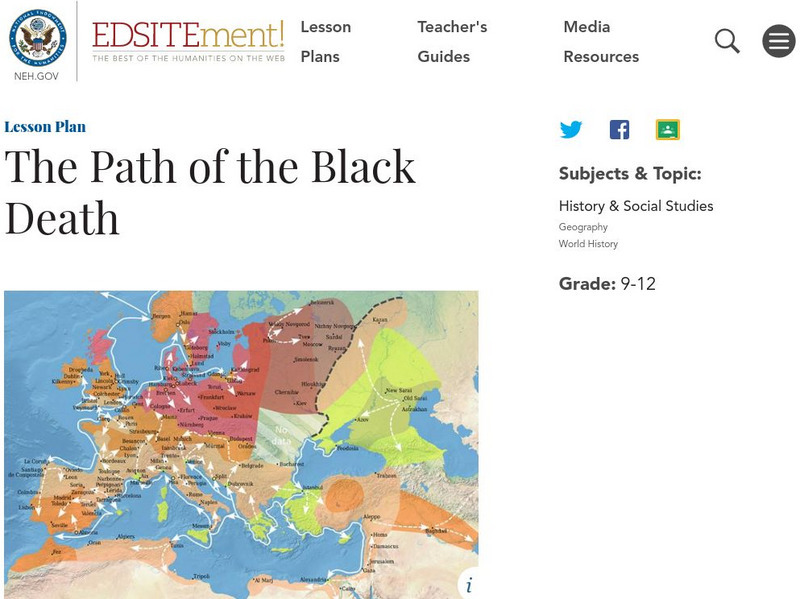
Neh: Edsit Ement: The Path of the Black Death
The Black Death caused a radical alteration in population and dramatic changes in society. In this lesson, students will analyze maps, documents, and firsthand accounts to trace the effects of the Black Death in Europe.
Middle School Science
Hurricane Unit
In this comprehensive site you will find links to the following topics: parts of the hurricane, naming hurricanes, stages of development, rating hurricanes, online tracking of hurricanes, printable tracking maps, hurricane safety,...
Dan Satterfield
Dan's Wild Weather Page: Hurricanes
Use this site to find out about hurricanes and how to track them.


