Curated OER
Arkansas Black Pioneers: A History of African-American Colonies in Arkansas
Learners research regions of early Arkansas as they relate to African American colonies in Arkansas after the Civil War. They discuss the characteristics of the regions, view a Powerpoint presentation, and write reflective journals.
Curated OER
A Geographic Study of Florida's Diverse Community
Eighth graders identify major population centers and their demographic features using an outline map of Florida and the Internet to.
Curated OER
People and Parks in the U.S.A.
Fifth graders explore the National Parks in the United States. After locating specified states, 5th graders predict which states have the most National Parks. Given the population of each state, students determine the average acre per...
Curated OER
An Act of Courage, The Arrest Records of Rosa Parks
Students research accounts on Rosa Parks and look for differences between the modern form and an older report on Parks. They discuss why information about race and nationality are collected on these and other forms.
Curated OER
New Perspectives On Teaching Afro-American History
Students examine the Great Migration of African Americans to the North from the South. After reading a primary source document, they respond to the letter given a set of questions. In groups, they research the funding for white and...
Curated OER
Barefoot and Pregnant
Students address the problem of a reduction in the world population growth rate being offset by a growing world population base. This problem is particularly true with the rapid population growth in many Third World countries. The lesson...
Curated OER
Free African-Americans in Delaware
Students work in groups of two and review the Abolitionist Movement. They observe the manumission/city directory and discover what it is and why it is so important. They read the manumission aloud and discuss why they were freeing their...
Curated OER
Average Vehicle Occupancy In Your Community
Students determine the average vehicle occupancy in their community. In this transportation lesson students develop and analyze a survey to determine attitudes towards air pollution and transportation.
US Census Bureau
Us Census Bureau: The Art of Persuasion: Using Census Data to Influence Others
For this lesson, students will incorporate information from the U.S. Census Bureau's QuickFacts data access tool into an advertisement for a city of their choice. They will use persuasive and advertising techniques to convince others to...
US Census Bureau
Us Census: Percentage of People Who Walk to Work in Cities and Population Size
Using census data, young scholars will create box plots to make inferences about the percentages of people who walk to work in cities of different population sizes (small, medium, and large). Students will use these findings to write a...
Other
Statistics Canada: Add! Don?t Subtract! A Complete Count
In this learning activity from Statistics Canada, students will learn the value of census data when it is totaled and linked with different geographic regions. As part of this lesson, students will work with a neighbourhood map and...
US Census Bureau
United States Census Bureau: Numbers That Tell a Story
Using State Facts for Students, a data access tool from the U.S. Census Bureau, students will explore data about their state and voice their opinions on how the population has changed over time. Students will work in small groups to...
Science Education Resource Center at Carleton College
Serc: The Digital Divide: A Data Analysis Activity Using Subtotals
A lesson plan that includes a PowerPoint learning module for students. The purpose of the lesson is to teach how to use Excel to analyze a large amount of data, in this case from the US Census. The example being used is the accessibility...
Center for Innovation in Engineering and Science Education, Stevens Institute of Technology
Ciese: Population Growth Project
In this collection of nine lessons, students use data from the U.S. Census to create population growth models and to examine the impact of changes in population factors such as age, demographic, etc.
Discovery Education
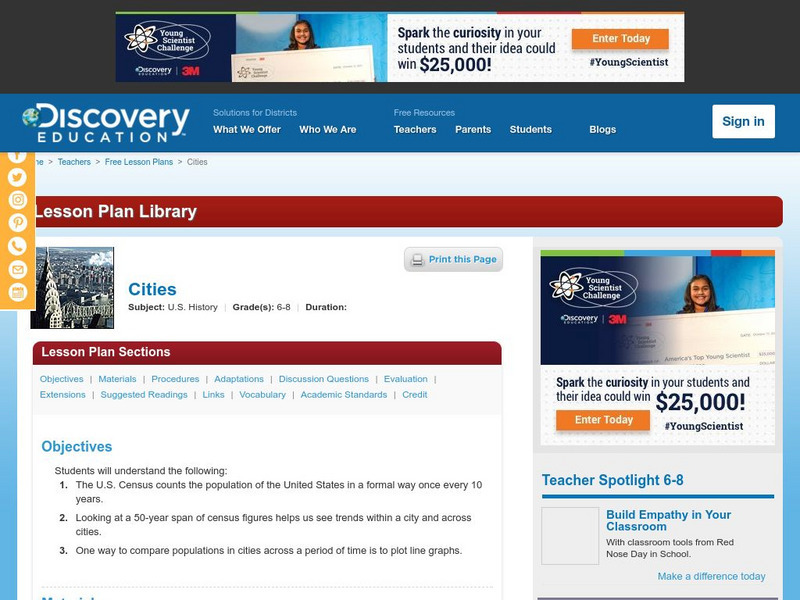
Discovery Education: Cities
This lesson plan shows that by studying the population of the U.S. through census figures, students can learn about interesting cultural and economic trends.
PBS
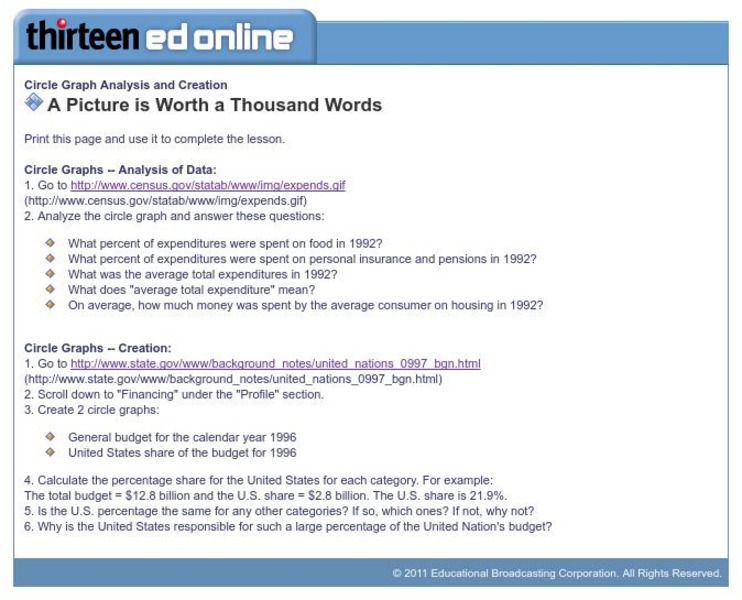
Wnet: Thirteen: Circle Graph Analysis and Creation
This site, which is provided for by WNET, gives a great way to practice using circle graphs through these exercises. One is analyzing a pie graph from the Census Bureau and the other creating pie charts using government data.
University of Regina (Canada)
University of Regina: Math Central: Measurement Activity
This is a lesson using data from "Census at School" to predict your adult height using your current height.
Other popular searches
- Data, Census, & Statistics
- Analyzing u.s. Census Data
- Analyzing Census Data
- Data Census & Statistics
- Graphing Census Data
- United States Census Data
- Graphing Using Census Data
- 2010 Census Data
- Census Data 1860s
- Historical Census Data Browser
- Analyzing Us Census Data
- Data Census


