Curated OER
Flavorful Spreadsheets
Students create a spreadsheet which includes a bar graph. They sort and classify information and use the average function on a spreadsheet. They research Skittles candy and summarize their findings on a spreadsheet.
Curated OER
Data Analysis
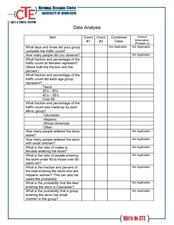
In this data analysis worksheet, students complete several activities to analyze data. Students calculate the mean, median, mode, and range for the 14 problems.
Curated OER
Data Analysis
Students examine techniques to represent data. In this data analysis instructional activity, students read about various ways to represent data, such as a stem and leaf diagram and calculating standard deviation. Students complete data...
Curated OER
Charting the Heights
Students enter data regarding the height of classmates into a spreadsheet. Formulas will also be entered to find the median, mean, and mode of the data.
Curated OER
Bones and Math
students identify and explore the connection between math and the bones of the human body. Students collect data about bones from their classmates and from adults, apply formulas that relate this data to a person's height, and organize...
Curated OER
How is Your Driver Doing?
Sixth graders explore the concept of averaging of numbers and the function of a spreadsheet. Data is collected, analyzed, and displayed in this lesson. The NASCAR race results provides the basis for the collection of data.
Curated OER
What Does Average Look Like?
Fifth graders, in groups, study the concepts of range, median, mode, and mean through the use of graphs drawn from models. They use manipulatives to represent data that they have collected within groups.
Curated OER
Penny Basketball: Making Sense of Data
Explore four web-based interactive sites to develop a baseline understanding of statistics. Learners play a series of penny basketball games and collect data regarding their shooting statistics. Groups decide who is the "top" penny...
Curated OER
Histograms
Young statisticians explore the concept of histograms. They construct histograms of various data such as change in a student's pocket, and guessing on a test. hHey analyze data represented as a histogram and a box plot and compare...
Curated OER
Home is the Place
Students apply the concepts of computation, area/perimeter; maximum/minimum; percentage; statistics; and scale drawings to a real world situation. They plan their dream home within a given set of constraints such as budget and zoning.
Curated OER
The Grapes of Math
Students "think" through mathematical problem solving and provide solutions using a variety of strategies after listening to Greg Tang's book, The Grapes of Math.
Curated OER
Eat Your Veggies
Students investigate displaying data. In this displaying data lesson, students use tallies to count data about food preferences. Students use various types of graphs such as bar graphs, picture graphs, box-and-whisker plots, etc to...
Curated OER
Looking at Data
Third graders use two days to create, collect, display and analyze data. Classroom activities and practice build greater understanding to a variety of forms used to display data.
Curated OER
Weather for Health
Ninth graders encounter various types of numerical information (represented in multiple ways), much of which is abstract and difficult to comprehend. In this lesson, 9th graders will convert given information into bar graphs. In the...


