Curated OER
Central Tendency
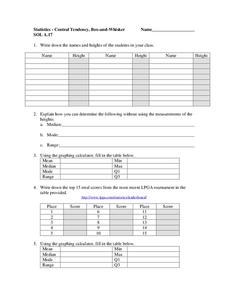
For this central tendency worksheet, students solve and complete 10 different problems that include measures of central tendency. First, they write down the names and heights of students in their class. Then, students explain how they...
Curated OER
Statistics - Central Tendency
In this statistics worksheet, students solve and complete 13 different problems that include creating various box-and-whisker plots. First, they write a definition for mean, median, mode and range. Then students explain how to determine...
Curated OER
Central Tendency
Fifth graders compare and contrast different sets of data on the basis of measures of central tendency.
Curated OER
An Introduction to Elementary Statistics
Students explain and appreciate the use of statistics in everyday life. They define basic terms used in statistics and compute simple measures of central tendency.
Curated OER
The Air Up There
Students observe the weather over a period of two weeks. They gather local weather data and calculate the mean and average figures from the data. They prepare a graph with their observations.
Curated OER
Shedding Light on the Weather with Relative Humidity
Learners study weather using a graphing calculator in this lesson. They collect data for temperature and relative humidity for every hour over a day from the newspaper, then place the data in their handheld calculator and examine it for...
Curated OER
Under the Weather
Students review mean, median, mode, and range while using the newspaper to answer weather questions.
Curated OER
The Air Up There
In this data collection and analysis lesson, students observe and graph the weather conditions during one school week, then calculate the average weather temperature. Extensions are included.
Curated OER
Mean, Median and Mode
Fourth graders describe weather data using the mean, median and mode. For this mean, median and mode lesson, 4th graders understand how to calculate data using mean, median and mode and why they would use each one.
Curated OER
Mean, Median and Mode
Students explore websites and the included PowerPoint presentation to gain a better understanding of mean, median and mode. A weather worksheet is included for in-class work and assessment.
Curated OER
Using Computers for Statistical Analysis of Weather
Students use temperature, cloud cover and other weather data from the S'COOL website to statistically analyze weather around the country. They use computers to calculate and graph standard deviations, means and modes of the weather...
Curated OER
How's The Weather?
Students make a box and whiskers plot using the TI-73 graphing calculator. Each student would have their own calculator but they would work in small groups of two or three to help each other enter the data and make the plots.
Curated OER
Data Analysis
In this data analysis worksheet, students answer 4 questions using a weather report chart. Topics include mean, median, mode and range.
Curated OER
Range, Mean, Median, and Mode
Eighth graders find the range, median, mean, and mode of a data set. In this finding the range, median, mean, and mode of a data set lesson, 8th graders collect data about the high and low temperature for 10 different cities. Students...
Curated OER
Cruise Conditions Graphing & Statistics
Students monitor weather conditions for an eighteen day period at a specific location. The temperature of both air and water is taken and the mean, median, and mode calculated. Differences between the highest and lowest recordings are made.
Curated OER
Finding the Average Temperature
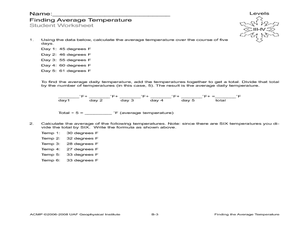
Students calculate averages. In this average temperature lesson plan, students collect data and use their problem solving skills to calculate average temperatures.
Curated OER
Temperature Bar Graph
Students explore mean, median and mode. For this math lesson, students analyze temperature data and figure the mean, median, and mode of the data. Students graph the data in a bar graph.
Curated OER
Investigating Median, Mode, and Mean
Learners develop strategies to organize data while following teacher demonstration. They calculate the mean, median and mode of a data set while determining the relationships between the numbers. They analyze data from tables and double...
Curated OER
Weather for Health
Ninth graders encounter various types of numerical information (represented in multiple ways), much of which is abstract and difficult to comprehend. For this lesson, 9th graders will convert given information into bar graphs. In the...
Curated OER
Averages: Computing Mean, Mode and Median
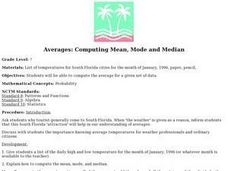
Seventh graders use daily temperature models to find the mean, mode and median.
Curated OER
Probability: the Study of Chance
Students experiment to determine if a game is fair, collect data, interpret data, display data, and state and apply the rule for probability. Students use a simple game for this experiment.


