Annenberg Foundation
Reading Maps
Can you read a map? Scholars use an interactive technology tool to analyze maps of various kinds to gather evidence and data to better understand their meanings and usefulness. Using newly obtained knowledge, they form an interpretation...
University of Richmond
Foreign-Born Population 1850-2010
If America is a nation of immigrants, where are they from and why did they come? Demographic data and interactive maps help pupils consider answers to these questions by examining the statistics of foreign-born Americans. Features allow...
Howard Hughes Medical Institute
BiomeViewer
Which holds more influence, the environment over humans or humans over the environment? Young scientists explore an online interactive that addresses this discussion. They observe changes in the natural world over time and see which...
Curated OER
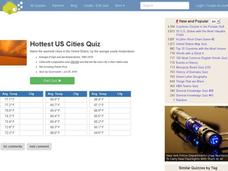
Hottest US Cities Quiz
In this online interactive geography quiz worksheet, students respond to 20 identification questions about the hottest cities in the United States. Students have 4 minutes to finish the timed quiz.
Curated OER
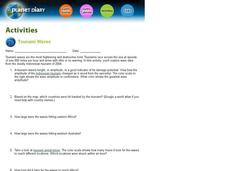
Tsunami Waves
In this tsunami waves worksheet, students explore data from the Indonesian tsunami of 2004 and answer ten questions about the data. They draw conclusions about the devastation and destruction based on the amplitude and speed of the tsunami.
Curated OER
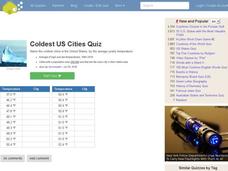
Coldest US Cities Quiz
In this online interactive geography quiz worksheet, students respond to 20 identification questions about the coldest cities in the United States. Students have 4 minutes to complete the quiz.
Burke Museum
Burke Museum: Waterlines: Discover & Explore Seattle's Past Landscapes
Seattle is one of the most dramatically engineered cities in the USA. This rich interactive website enables people to see how Seattle's various landscapes have changed over time. The site starts out with an interactive map of the Puget...


