University of North Carolina
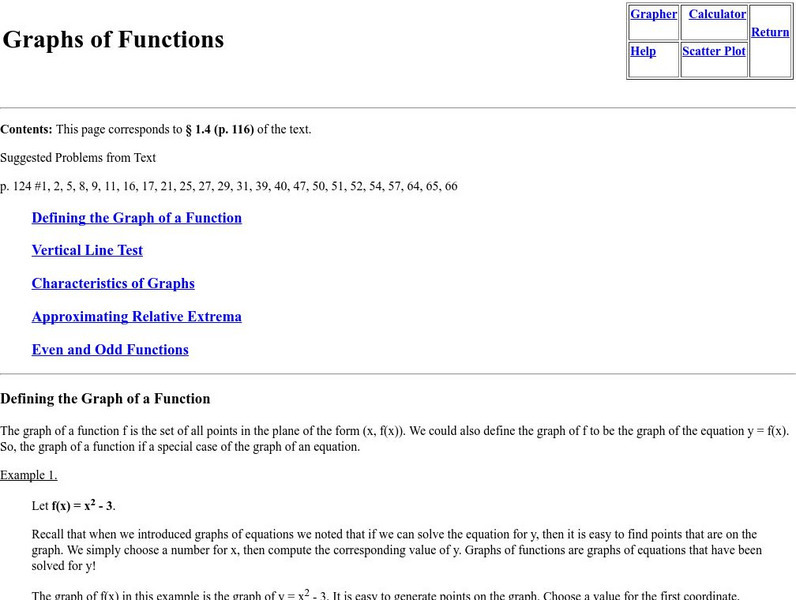
University of North Carolina Wilmington: Graphs of Functions
Defining the graph of a function, vertical line test, characteristics of graphs, approximating relative extrema, and even and odd functions are covered with examples that include charts and graphs.
PBS
Pbs Kids Afterschool Adventure!: Operation: All About Us Activity Plan
It's time to stand in the spotlight! During this Afterschool Adventure, children will learn about and practice a variety of math skills as they gather information about their favorite subject-themselves! Children will start out by...
Shodor Education Foundation
Shodor Interactivate: Pie Chart
Students investigate how a pie chart can be used to display data graphically. The resource includes the activity and instructor resources.
Other
Us Government: Fed Stats
This site shows charts, graphs, and information from more than 70 agencies in the United States Federal Government that produce statistics of interest to the public.
Utah Education Network
Uen: Balanced Diet
In this lesson, 2nd graders will learn about the components of a balanced diet. Students will analyze charts and then self-report their own foods in categories. Several fiction and nonfiction books are listed as additional resources.
EL Education
El Education: Reshaping Rochester
After learning about the effects of re-watering a dry water way in their city, students realize that public support would be needed for such an undertaking. In order to determine public support, students design and implement a survey,...
Simon Fraser University
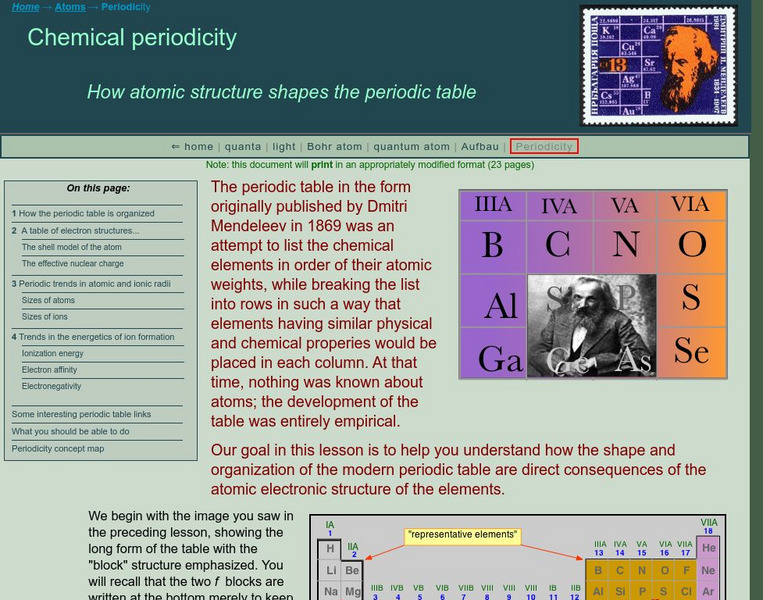
Chem1 Virtual Textbook: Periodic Trends in Ion Formation
Acting as a subtopic of the General Chemistry Virtual Textbook's section on Atoms and the Periodic Table, this site discusses electron affinity and ionization energy in relation to ion formation. Charts and graphs are included as well.
Other
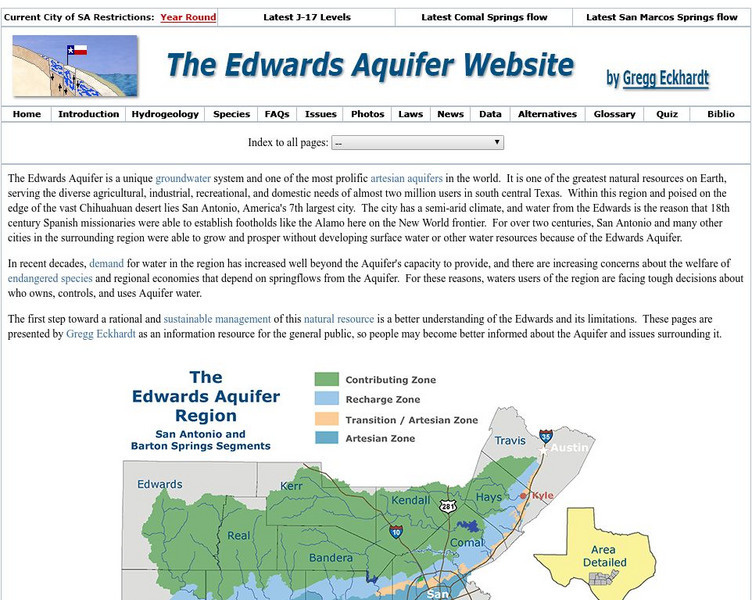
The Edwards Aquifer: Homepage
In hopes of informing the citizens of the Edwards Aquifer region, Gregg Eckhardt has set up a site presenting facts about the Edwards Aquifer in Texas. Included are links to questions and answers, endangered species, charts and graphs,...
Tutor2u
Tutor2u: Long Run Costs
A comprehensive, yet sophisticated explanation of long run costs of production. Includes charts and graphs to illustrate key points and concepts. Somewhat advanced in places.
Other
Federal Reserve Bank of Cleveland: Inflation Central
Students track inflation in the United States and across the world. The resource consists of articles on economic trends, economic commentary, charts, and graphs.
Alabama Learning Exchange
Alex: Determining Percent of Seed Germination
In this project, students will conduct an experiment to determine the percentage of seed that will germinate in a given time frame. Students will produce charts and graphs to represent the results algebraically. Mathematics and...
Alabama Learning Exchange
Alex: Ice Cream Sundae Survey
Learners quickly realize the importance of learning how to read and find information in charts, graphs, and tables compared to finding the same information written in a paragraph. This is a fun, high energy lesson!This lesson plan was...
Robert Schenk, PhD
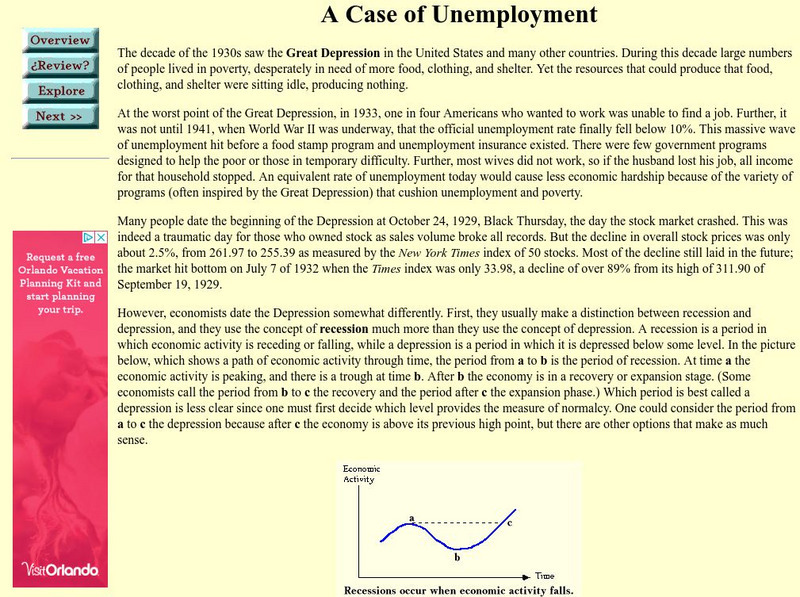
Cyber Economics: Intro to Macro: A Case of Unemployment
Case study of unemployment and the economy of the Great Depression offers analysis and postulates theoretical outcomes. With charts and graphs.
PBS
Pbs Kids Afterschool Adventure!: Operation: Martha's Stem Stories Activity Plan
Welcome to Martha's STEM Stories! STEM stands for science, technology, engineering, and mathematics. You may already know that doing STEM means testing ideas, collecting data, making calculations, and drawing graphs and charts-but you...
ReadWriteThink
Read Write Think: A Picture's Worth a Thousand Words: Image to Narrative
This lesson, which can be adapted to fit with any picture you choose, works for students of all levels.
NOAA
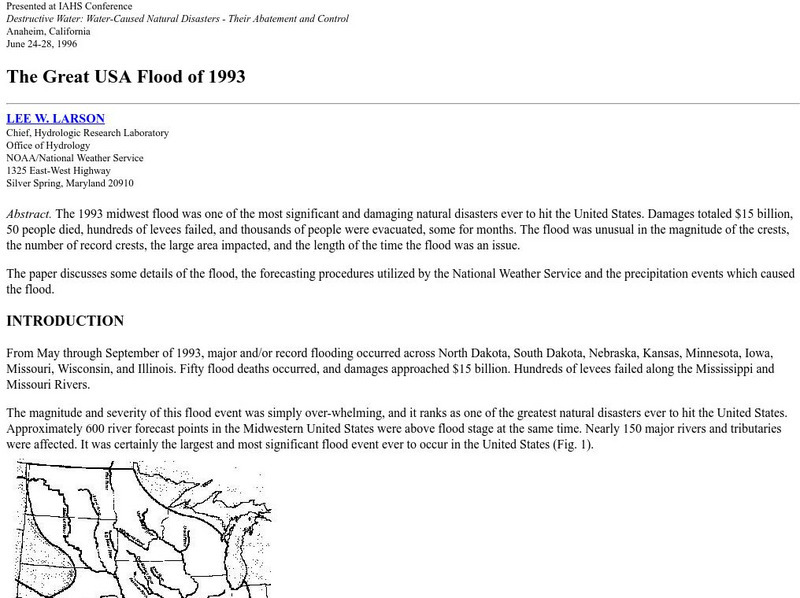
Noaa: The Great Usa Flood of 1993
Interesting abstract about the flood that hit the Midwest in 1993, one of the worst floods in United States History. Find out why the flood occurred, the damage, maps of the damage, charts, graphs, and statistics.
Food and Agricultural Organization of the United Nations
Faa: Forests and Forestry
This site from the Food and Agriculture Association of the United Nations is an excellent, detailed presentation of survey results about European attitudes towards forests and forestry. Helpful graphs and charts illustrate the survey...
Lumen Learning
Lumen: Boundless Communications: Using Statistics
This lesson focuses on using statistics in your speeches including understanding statistics, common misunderstandings of statistics, guidelines for helping your audience understand statistics, and using visual tools for incorporating...
Other popular searches
- Pie Charts and Graphs
- Reading Charts and Graphs
- Behavior Charts and Graphs
- Charts and Graphs Candy
- Interpret Charts and Graphs
- Charts and Graphs Christmas
- Charts and Graphs Math
- Analyzing Charts and Graphs
- Tables, Charts and Graphs
- Charts and Graphs Europe
- Using Charts and Graphs
- Bar Graphs and Charts
