Science Buddies
Science Buddies: Scientific Method Data Analysis/graphs
At the end of your experiment you should review all of the data you have collected. See samples of data analysis charts and graphs. Find out what makes for a good chart or graph using the self-grading rubrics.
Better Lesson
Better Lesson: Circle Graph Activity
This lesson will allow the student to work through three stations. The stations will focus on creating and analyzing circle graphs. The students will be using technology to create their graphs along with a hands-on activity using M&M's.
Purple Math
Purplemath: Graphing Linear Equations: T Charts
A nice tutorial on how to graph linear equations. Goes through the process step by step and gives numerous examples.
Other
Delta State University: Lesson Plan 3: Pie Graphs
The students will gather, organize, and display data in an appropriate pie (circle) graph using M&M's! [PDF]
McGraw Hill
Glencoe: Self Check Quizzes 1 Circle Graphs
Use Glencoe's randomly generated self-checking quiz to test your knowledge of circle graphs. Each question has a "Hint" link to help. Choose the correct answer for each problem. At the bottom of the page click the "Check It" button and...
The Math League
The Math League: Using Data and Statistics: Pie Charts
This introductory tutorial about statistical graphing with four examples of how pie charts (circle graphs) are constructed and read.
Math Planet
Math Planet: Pre Algebra: Circle Graphs
Learn about circle graphs or pie charts through examples and a video lesson.
Texas A&M University
Wtamu Virtual Math Lab: Beginning Algebra: Reading Graphs
A good introduction to reading bar, line, and double line graphs, and drawing and reading Venn diagrams. Contains definitions and examples of these types of charts and graphs as well as practice exercises that ask you to answer questions...
Better Lesson
Better Lesson: Circle Graph Activity
This lesson will allow the student to work through three stations. The stations will focus on creating and analyzing circle graphs. The students will be using technology to create their graphs along with a hands on activity using M &...
Richland Community College
Richland Community College: Stats Graphs Defined
Richland Community College provides a glossary of many terms that are needed in order to understand statistics graphs and charts. Each of the types of charts is quickly explained in terms of what it is most effective in displaying.
The Math League
The Math League: Using Data and Statistics
This site contains two short examples of line graphs, charts that show change over time. This is a quick introduction to the topic of statistical graphing.
Council for Economic Education
Econ Ed Link: The Economics of Homebuying
This lesson plan analyzes the costs and benefits of homeownership and asks the student to describe the factors that affect affordability, use cost-benefit analysis and knowledge of home-buying procedures to reduce the costs, analyze the...
PBS
Pbs: The Lowdown: u.s. Gun Homicides: Visualizing the Numbers
Explore firearm deaths in the United States in 2010 by type, race, and age group in this interactive from KQED. In the accompanying classroom activity, students are presented with a simple question: Is America a safe place to live? In...
Council for Economic Education
Econ Ed Link: Demand Shifters
Check out this informative economics lesson plan that teaches about demand, and factors that cause demand for a good or service to change. Students learn to recognize factors that influence one's behavior as a consumer.
Missouri State University
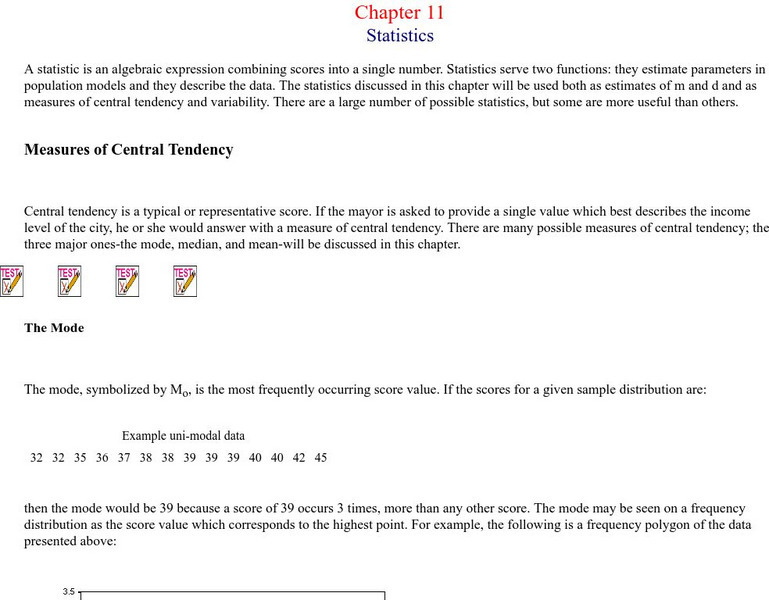
Missouri State University: Introductory Statistics: Statistics
This is an excellent resource on what the science of statistics involves. There are all kinds of definitions, examples, graphs, and charts to learn from. The topics covered include: mode, mean, median, skewed distributions and measures...
Other
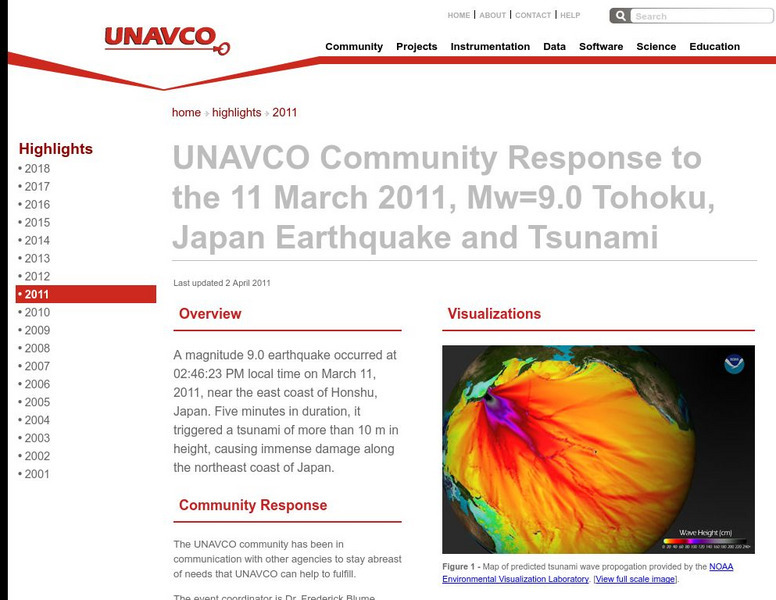
Unavco: Event Response to the Mw=9.0 Tohoku, Japan Earthquake and Tsunami
Relevant data connected to the earthquake as well as links to technical information and science websites. Also find many graphs and charts with information on the tectonic activity.
Other
Penn State University: Energy and Fuels in Society
This site, which is provided for by the Penn State University, gives twenty one chapters of charts, graphs, and information on synthetic fuels.
The Math League
The Math League: Ratio and Proportion
This tutorial provides definitions and examples of ratios and proportions and features comparing ratios and converting rates.
English Zone
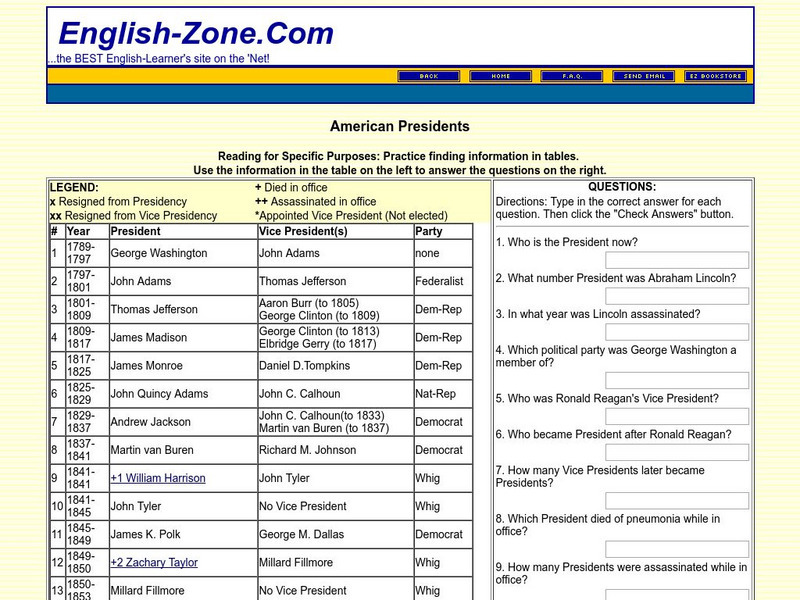
English Zone: American Presidents: Reading for a Specific Purpose
In this activity, information about American presidents is provided in chart format on the left and asks students to use the chart to answer the questions on the right. Note: the last president listed is George W. Bush. Java is required.
Other popular searches
- Pie Charts and Graphs
- Reading Charts and Graphs
- Behavior Charts and Graphs
- Charts and Graphs Candy
- Interpret Charts and Graphs
- Charts and Graphs Christmas
- Charts and Graphs Math
- Analyzing Charts and Graphs
- Tables, Charts and Graphs
- Charts and Graphs Europe
- Using Charts and Graphs
- Bar Graphs and Charts

