NOAA
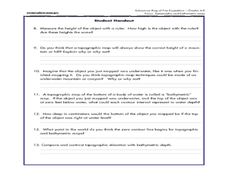
Mapping the Deep-Ocean Floor
How do you create a map of the ocean floor without getting wet? Middle school oceanographers discover the process of bathymetric mapping in the third installment in a five-part series of lessons designed for seventh and eighth graders....
Laboratory for Atmospheric and Space Physics
Charting the Progress of New Horizons
In 2006, New Horizons began its mission to fly to Pluto. As it continues its journey, scholars track its progress with the help of an informative website, all the while reinforcing measurement concepts with the construction of a scaled...
Texas State Energy Conservation Office
Investigation: Concept Mapping Fuels
After reading an article, "Fuels for Everything," collaborative groups create a concept map poster of the transportation and non-transportation fuels. This makes a strong introduction to the different types of fuels used for transportion...
Curated OER
Lights, Shoals & Soundings
Students explore nautical charts and their symbols, with a bit of fun thrown in.
Curated OER
Current Earthquake Activity
Fifth graders record any earthquake activity throughout the school year on various maps. In groups, they identify a map locating the points given to them by their teacher. To end the lesson, they add the date, strength and damage to each...
Curated OER
A world of oil
High schoolers practice in analyzing spatial data in maps and graphic presentations while studying the distribution of fossil fuel resources. They study, analyze, and map the distribution of fossil fuels on blank maps. Students discuss...
Curated OER
Chart Making for Navigators
Students discuss the importance and function of nautical maps for sailors. They, in groups, take soundings of a simulated bay in a shoebox and develop a nautical chart that enable them to navigate the shoebox safely.
Curated OER
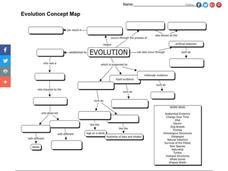
Evolution Concept Map
In this evolution concept map worksheet, 7th graders use the vocabulary terms related to evolution to complete the evolution concept map.
Consortium for Ocean Science Exploration and Engagement (COSEE)
Climate Change Impacts on Blue King Crabs
Carbon dioxide is not only causing global temperatures to increase, it causes the oceans to become more acidic. Lesson focuses on the blue king crab and the fragility of the habitat due to climate change. Scholars create a concept map...
Curated OER
From Restriction Maps to Cladograms
Biology aces analyze restriction maps to determine the relationships among different primate species and then complete a cladogram. Preface this instructional activity with an explanation of how restriction enzymes are used to create the...
Curated OER
Using Star Charts and Maps
Students study star charts and describe locations of objects. For this scientific models lesson students use coordinates and identify characteristics.
K-State Research and Extensions
Water
How are maps like fish? They both have scales. The chapter includes six different activities at three different levels. Scholars complete activities using natural resources, learn how to read a map, see how to make a compass rosette,...
Curated OER
Planting Time
High schoolers research crops grown in the United States. In this agriculture lesson, students identify various crops cultivated across the United States as they create charts and maps that note the information.
Curated OER
Human Genetic Diseases
Although there are a few missing titles in this collection of slides, if your class has the support of a genetic disease lecture to accompany it, this resource will be very useful. The mechanism of genetic inheritance is covered. Flow...
Curated OER
Human Genetic Diseases
Although there are a few missing titles in this collection of slides, if your class has prior knowledge of genetic diseases then this resource could be useful. The mechanism of genetic inheritance are covered and both flow charts and...
Conneticut Department of Education
Instructional Strategies That Facilitate Learning Across Content Areas
Imagine 28 instructional strategies, appropriate for all subject areas and all grade levels. Directed Reading-Thinking Activities (DRTA), Question-Answer Relationship (QAR) activities, KWL charts, comparison matrixes, classification...
Curated OER
Principles of Flight: Where are We?
Students explore the concept of topographical maps. In this topographical map lesson, students discuss how airplanes know where to fly. Students use topographical maps to simulate a field trip on the computer.
Curated OER
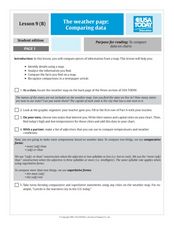
The Weather Page-Comparing Data
Students examine weather patterns in the United States. In this weather lesson, students use a United States map to identify high and low temperatures in two states. Students compare the data and record their findings onto a chart.
Curated OER
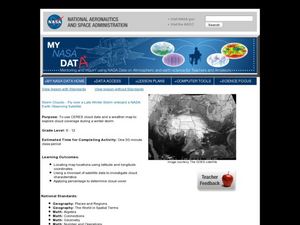
Storm Clouds-- Fly over a Late Winter Storm onboard a NASA Earth Observing Satellite
Students study cloud data and weather maps to explore cloud activity. In this cloud data lesson plan students locate latitude and longitude coordinates and determine cloud cover percentages.
Curated OER
Map the Constellations
Students build constellation guides from empty sotf drink cans. Using star charts, they use straight pins to mark the major stars in the constellations. After turning the charts over, they connect the dots. When they look through cans...
Curated OER
A Watered-Down Topographic Map
Eighth graders explore the ocean floor. In this topography activity, 8th graders compare topographical maps to bathymetric charts. They will create a topographic map and note landmarks and other land features.
Curated OER
Mapping the Sea Floor
Students review their prior knowledge on topographical maps. Using a map, they examine the sea floor off the coast of San Diego, California. With a partner, they chart the sea floor of an area and use cutouts to create a visual...
Curated OER
Idea Mapping
Students generate, share and display ideas as a group. They break into small groups to work on hand-drawn maps made up of concentric circles. they come before the group and make a similar diagram by charting each other's characteristics.
Curated OER
Mapping The Ocean Floor
Young scholars explore and analyze the bottom structure of underwater habitats. They describe and explain what can't see through the collection and correlation of accurate data. Learners assess that technology is utilized as a tool for...
Other popular searches
- Maps and Charts
- Analyze Maps and Charts
- Reading Maps and Charts
- Ireland Maps and Charts
- Tables, Maps and Charts
- Maps Graphs and Charts
- Maps, Charts, Globes
- Interpreting Charts and Maps
- Tables Maps and Charts
- Graphs, Charts and Maps
- Graphs\, Charts and Maps
- Word Maps and Charts


