Columbus City Schools
What is Up Th-air? — Atmosphere
Air, air, everywhere, but what's in it, and what makes Earth's air so unique and special? Journey through the layers above us to uncover our atmosphere's composition and how it works to make life possible below. Pupils conduct...
Columbus City Schools
Totally Tides
Surf's up, big kahunas! How do surfers know when the big waves will appear? They use science! Over the course of five days, dive in to the inner workings of tidal waves and learn to predict sea levels with the moon as your guide.
Curated OER
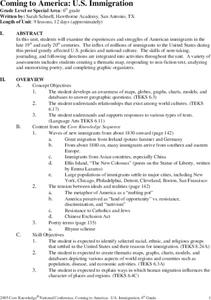
Coming to America: U.S. Immigration
Students study immigration in the late 19th and early 20th century. In this immigration lesson plan, students participate in activities including creating maps, responding to non fiction text, memorizing and analyzing poetry, and...
Curated OER
From Sea to Shining Sea
Students study the geography of the United States of America. Students write letters, create travel brochures, make maps, graph population numbers, read fiction and nonfiction selections, complete KWL charts, and watch films.
Curated OER
You Scratch my Back, I'll Scratch Yours
Students explore the concept of interdependence. In this integrated interdependence lesson, students interpret graphs and charts that require them to analyze the relationship between Mexico and the United States. Students also...
E-learning for Kids
E Learning for Kids: Math: Elephant Plant: Data and Graphs
On this interactive website students practice various math skills using a real-life scenario involving plants. Those skills include interpreting data in a circle graph, interpreting data in a divided bar graph, and interpreting a bar...
E-learning for Kids
E Learning for Kids: Math: Group of Pyramids: Fractions and Graphs
On this interactive website, students practice various math skills using a real-life scenario at the pyramids. Those skills include showing percentages as fractions and decimals and interpreting data in a sector graph.
Texas Education Agency
Texas Gateway: Evaluate Graphics in Informational/procedural Text
You will learn how to evaluate graphics for their clarity in communicating meaning and achieving a specific purpose.
E-learning for Kids
E Learning for Kids: Math: Tea Store: Reading a Table
Students will demonstrate how to interpret information in a table.
Texas Education Agency
Texas Gateway: Synthesize Ideas in Informational/expository Text
[Accessible by TX Educators. Free Registration/Login Required] Learn how to synthesize and make logical connections between ideas within a text and across two or three texts representing similar or different genres and to support the...
Sophia Learning
Sophia: Choosing Whether to Use Software or Technology to Enhance Ideas
A tutorial explaining how to use technology to create graphics and visuals to enhance documents and presentations. A brief audiovisual presentation identifies types of visuals, and another audiovisual presentation describes how and when...
Other popular searches
- Maps Graphs and Charts
- Graphs, Charts and Maps
- Graphs\, Charts and Maps
- Charts, Graphs, Maps
- Maps, Charts, Graphs, Tables


