Mathed Up!
Pie Charts
Representing data is as easy as pie. Class members construct pie charts given a frequency table. Individuals then determine the size of the angles needed for each sector and interpret the size of sectors within the context of frequency....
EngageNY
Algebra II Module 2: Mid-Module Assessment
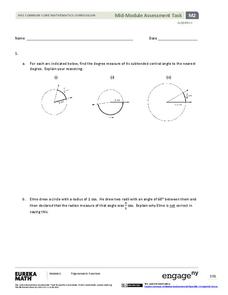
Time for classes to show what they've learned. Use several tasks to assess understanding of the trigonometric functions, unit circle, radians, and basic trigonometric identities.

