Beyond Benign
Municipal Waste Generation
Statistically, waste may become a problem in the future if people do not take action. Using their knowledge of statistics and data representation, pupils take a look at the idea of waste generation. The four-part unit has class members...
Pace University
Grade 7 Earth Day Statistics with Circle and Bar Graphs
Take a tiered approach to studying waste. The lesson uses Earth Day to present differentiated instruction around using circle and bar graphs. Each group gets a cube based on their tiers and works collaboratively as well as individually...
Curated OER
Deciding Which Type of Graph is Appropriate
In this graphing instructional activity, students read about line, bar, and pie graphs and then determine which graph is the best way to express data results. This instructional activity has 3 short answer questions.
Curated OER
Introduction to Graphical Representation of Data Sets in Connection to Cellular Growth
Learners practice graphing relationships between variables by studying topics such as exponential growth and decay. They conduct a series of numerical experiments using a computer model and a variety of physical experiments using mold,...
Curated OER
Graph a Panther's Diet
Students examine the diet of panthers. In this interpreting data lesson, students collect data on the panther's diet and chart the data in bar and pie graphs.
Curated OER
Evidence of Change Near the Arctic Circle
Learners analyze graphs and make conclusions about climate change. In this climates lesson students produce graphs and identify relationships between parameters.
University of California
Seasons Lab Book
Unlock the mystery behind seasonal change with a collection of worksheets and activities. Whether they are drawing pictures of Earth's orbit around the sun or graphing the temperature and daylight hours of different locations...
Curated OER
Is there Treasure in Trash?
More people, more garbage! Young environmentalists graph population growth against the amount of garbage generated per year and find a linear model that best fits the data. This is an older resource that could benefit from more recent...
Curated OER
Discovering Mitosis in Onion Roots
Pupils discover the different stages of mitosis by examining onion roots under a microscope, drawing diagrams of what they see, and organizing collected data in a chart and create a pie graph from their lab data.
Curated OER
Introduction to Graphical Representation of Data Sets in Connection with Nuclear Decay
Students record data, make observations, and share in experimentation and discussion of numerical experiments.
Curated OER
Circle the Earth - Explore Surface Types on a Journey around Earth
Students use CERES percent coverage surface data with a world map in locating landmasses and bodies of water at Earth's Equator.
Curated OER
Excel temperature Graphs
Students gather data about the weather in Nome, Alaska. In this Nome Temperature lesson, students create an excel graph to explore the weather trends in Nome. Students will find the average weather and add a trend line to their graph.
Curated OER
How's The Weather?
Students make a box and whiskers plot using the TI-73 graphing calculator. Each student would have their own calculator but they would work in small groups of two or three to help each other enter the data and make the plots.
Curated OER
Weather "Whys" Lesson 2 Seasons
Students explore seasons. In this cross curriculum weather and seasons instructional activity, students identify characteristics of the four seasons and sequence related pictures. Students listen to poems and stories about trees in...
Curated OER
Finding the Basal Area of a Forest Plot to Determine Stocking Levels
Students use graphs and plots to measure the basal area and stocking levels. In this graphing instructional activity students work in the field the use their data to help them complete a lab activity.
Curated OER
High and Low Tides
Students collect real world data from the Web regarding high and low tides at various locations in the United States. They find a function which models this data and make predictions on tide levels based on the information found.
Curated OER
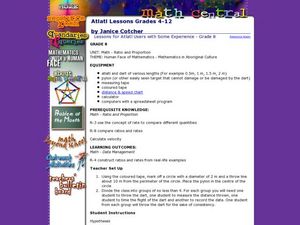
Atlatl Lessons for Grade 8
Eighth graders explore the weapons of the Aboriginal people. In this eight grade math/science lesson plan, 8th graders collect and analyze data regarding the speed and distance of a dart thrown with an atlatl. Students choose...
Curated OER
Ready for Roots
Fourth graders sort seeds and predict what conditions are needed for them to germinate. They keep the seeds moist, observe and measure their growth and graph the results. As the seeds start to grow students compare and contrast the each...
Curated OER
Scientific Inquiry: Periodic Motion
Young scholars construct their own pendulum. In this physics lesson, students design an experiment to find the factors affecting its period. They formulate a conclusion based on experimental data.
Curated OER
Graph Both Crusts
Fourth graders calculate the angles and construct a pie graph of the percentages of the elements in the continental and oceanic crusts. Then they analyze the results. They can be assigned the task of researching the percentages.
Curated OER
Color Your World with Changes --- the Camouflage Game
Seventh graders, after predicting dominant colors foud in their habitat or garden, visit heir area on a monthly basis. They search for colored toothpicks, then graph the results, determining the dominant color for the month.
Curated OER
Home on the Biome
Fifth graders study six major biomes, graph temperature and rainfall, and present their findings to the class.
Curated OER
A Shredding We Will Go
Students take charge of a recycling project . In this environmental issues lesson, students manage a paper recycling project and use compost made from the recycled paper to beautify trees.
Curated OER
Circling Around the CEENBoT Way!
Students investigate the forces present in a rotating body. In this physics lesson, students calculate centripetal force using a mathematical equation. They answer a quiz and writing prompt at the end of the lesson.


