McGraw Hill
Glencoe: Self Check Quizzes 2 Circle Graphs
Use Glencoe's Math Course 2 randomly generated self-checking quiz to test your knowledge of circle graphs. Each question has a "Hint" link to help. Choose the correct answer for each problem. At the bottom of the page click the "Check...
CK-12 Foundation
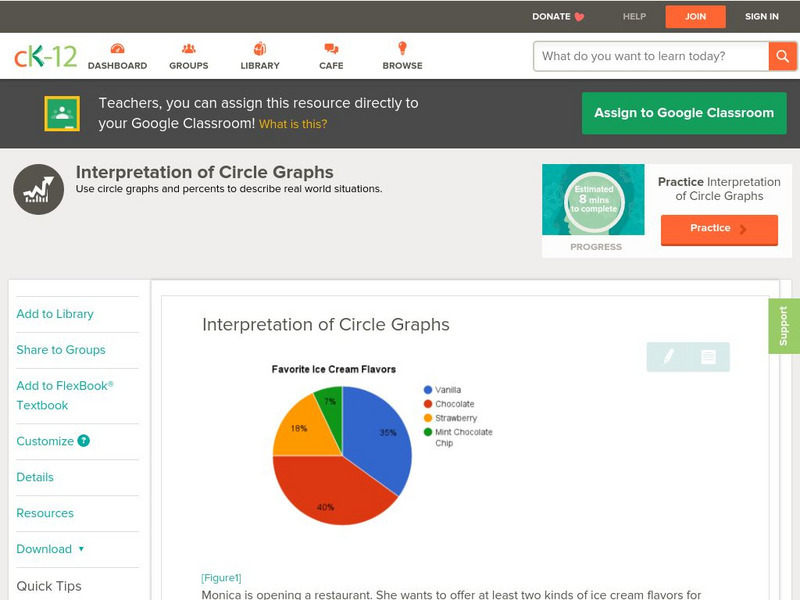
Ck 12: Statistics: Interpretation of Circle Graphs Grades 6 7
[Free Registration/Login may be required to access all resource tools.] Read and interpret circle graphs.
CK-12 Foundation
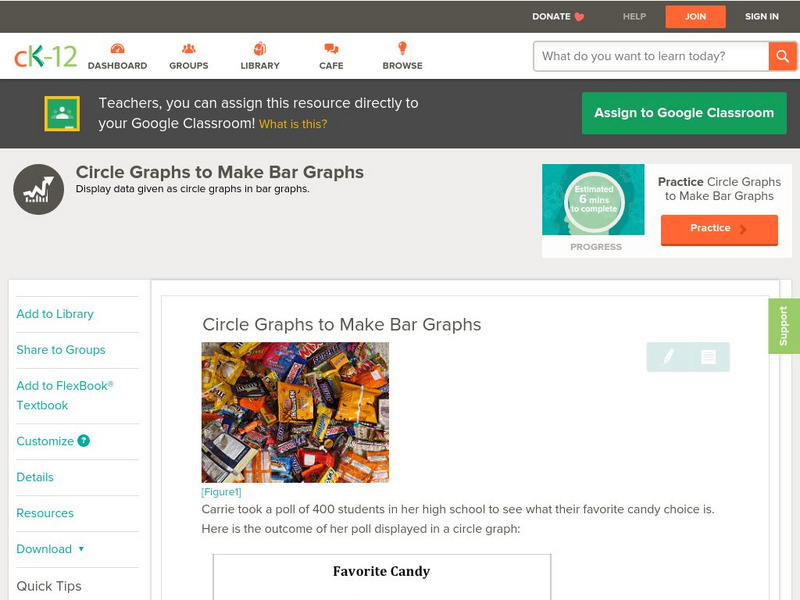
Ck 12: Statistics: Circle Graphs to Make Bar Graphs
[Free Registration/Login may be required to access all resource tools.] Create a bar graph using data displayed in a circle graph.
CK-12 Foundation
Ck 12: Statistics: Circle Graphs to Display Data Grade 7
[Free Registration/Login may be required to access all resource tools.] Make circle graphs by using given data.
CK-12 Foundation
Ck 12: Statistics: Interpretation of Circle Graphs Grade 7
[Free Registration/Login may be required to access all resource tools.] Interpret circle graphs by using given data.
Better Lesson
Better Lesson: Analyzing and Creating Circle Graphs
Sixth graders will be learning through exploration on how to analyze and create circle graphs and Venn diagrams.
Government of Alberta
Learn Alberta: Math Interactives: Exploring Data Display and Graphs
This multimedia Learn Alberta math resource focuses on graphing data. In the video portion, students will see how math is involved in the display of merchandise in stores. The accompanying interactive component provides an exploration...
CK-12 Foundation
Ck 12: Statistics: Circle Graphs to Display Data Grades 6 7
[Free Registration/Login may be required to access all resource tools.] Here you'll display data by using a circle graph.
E-learning for Kids
E Learning for Kids: Math: Movie Theater: Circle Graphs
On this interactive website, students practice interpreting information in circle graphs.
Varsity Tutors
Varsity Tutors: Hotmath: Practice Problems: Circle Graphs
Two problems present practice creating a circle graph from a data table. Both are given with each step to the solution cleverly revealed one at a time. You can work each step of the problem then click the "View Solution" button to check...
Varsity Tutors
Varsity Tutors: Hotmath: Algebra Review: Circle Graph
Find a quick, concise explanation of Circle/Pie Graphs. An example is given and step by step clearly explained.
Oswego City School District
Regents Exam Prep Center: Circles
Use this lesson, practice quiz, and activity when planning classroom instruction on graphs and equations of circles.
PBS
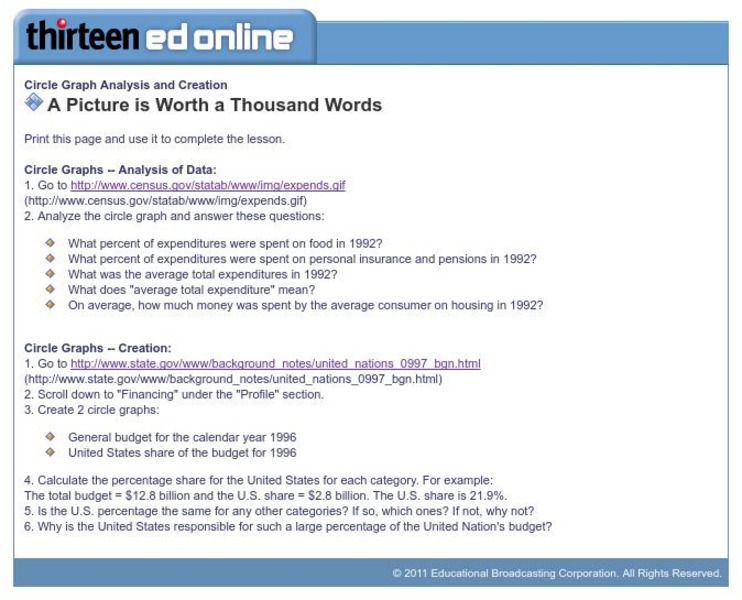
Wnet: Thirteen: Circle Graph Analysis and Creation
This site, which is provided for by WNET, gives a great way to practice using circle graphs through these exercises. One is analyzing a pie graph from the Census Bureau and the other creating pie charts using government data.
Paul Dawkins
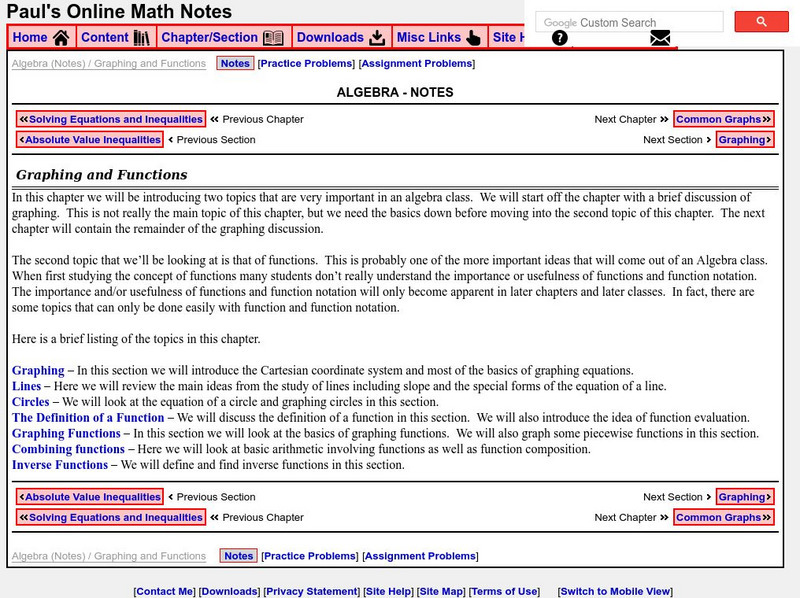
Paul's Online Notes: Algebra: Graphing and Functions
Students investigate functions and graphing. Topics examined are lines, circles, graphing functions, inverse functions, and combining functions. Class notes, definitions, and examples with detailed solutions are included. The class notes...
Texas Instruments
Texas Instruments: Circular Functions
In this activity, students find intercepts of circular function graphs. They also investigate the characteristics of such graphs.
Khan Academy
Khan Academy: Graph a Circle From Its Features
Given information about the center and radius of a circle, graph it. Students receive immediate feedback and have the opportunity to try questions repeatedly, watch a video or receive hints.
National Council of Teachers of Mathematics
Nctm: Illuminations: Circle Grapher
A computer applet that will draw any circle graph with student's data input.
Math Graphs
Houghton Mifflin: Math Graphs: Percents and Circle Graphs 1 [Pdf]
Students calculate the percent of the total income for sources of income and expenses. Learners then use this information to create a circle graph. The handout is available in PDF format.
Math Graphs
Houghton Mifflin: Math Graphs: Percents and Circle Graphs 2 [Pdf]
Students calculate the percent of the total expenses for sources of income and expenses. Learners then use this information to create a circle graph. The handout is available in PDF format.
Texas Instruments
Texas Instruments: Grandparents and Special Friends Day
This lesson was designed for our Grandparents and Special Friends day. It can be used for any visitation day, or an open house. The lesson is designed to review percent of a whole and the sector of the circle representing the percentage....
National Center for Ecological Analysis and Synthesis, University of California Santa Barbara
Ucsb / Pie Graphs (Piece of Cake)
This page gives an example and easy-to-understand description of a pie graph (circle graph.) Also provides an opportunity for students to test their abilities to read a pie graph.
Texas Instruments
Texas Instruments: Math Today the Next Frontier for Flight
This activity provides students the opportunity to gain experience in creating circle graphs on the calculator and provides an excellent real-world review of computation with percents.
ClassFlow
Class Flow: Reading Circle Graphs
[Free Registration/Login Required] Students are asked to figure out the size of the shaded portions of a circle graph. They then complete a chart showing the fraction, decimal, and percentage equivalents.
ClassFlow
Class Flow: Data Analysis Using Graphing
[Free Registration/Login Required] This flipchart allows students to analyze data using appropriate graphs, including pictographs, histograms, bar graphs, line graphs, circle graphs, and line plots introduced earlier, and using...
Other popular searches
- Percent Circle Graph
- Circle Graph Worksheet
- Circle Graph Template
- Interpreting Circle Graphs
- Circle Graph Protractor
- Circle Graph Activity
- Reading Circle Graphs
- Circle Graphs Pie Charts
- Circle Graph Central Angle
- Bar and Circle Graphs
- Circle Graph in Excel
- Family Budget Circle Graph

