Willow Tree
Circle Graphs
Pie isn't just for eating! Scholars learn to create pie charts and circle graphs to represent data. Given raw data, learners determine the percent of the whole for each category and then figure out the degree of the circle that percent...
Varsity Tutors
Varsity Tutors: Hotmath: Algebra Review: Circle Graph
Find a quick, concise explanation of Circle/Pie Graphs. An example is given and step by step clearly explained.
Math Is Fun
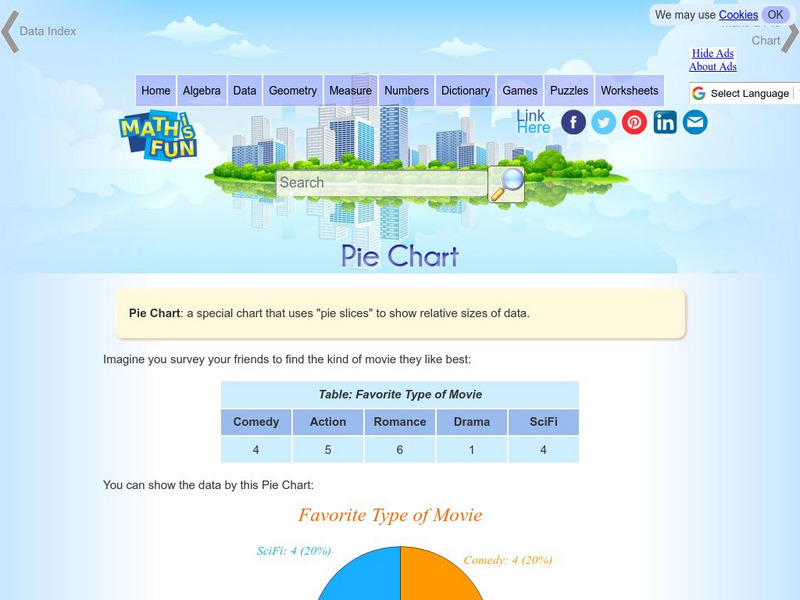
Math Is Fun: Pie Chart
Explains, with examples, what a pie chart is and how to make one. Includes a set of practice questions.


