Hi, what do you want to do?
Curated OER
Pen Light Lab
Students study what makes Earth warm and explore how different locations on the planetreceive different amounts of solar energy based on the intensity of the sun's rays. They calculate light intensities and compare the
amounts of light...
Curated OER
Trash a Pizza!
Students investigate data about America's trash production. In this environmental instructional activity, students use statistics about what we throw away to create an art pie chart project called a "trash pizza."
Curated OER
Measuring the Earth (Eratoshenes' method)
Sixth graders engage in problem solving, communicating, reasoning, and connecting to represent and solve problems, using geometric models.
Curated OER
Graphing
Students collect data to create different types of graphs-line, pie, and bar graphs. They use StarOffice 6.0 to create graphs.
Curated OER
A Recipe for Air
Students create a pie graph using M&Ms to demonstrate the composition of air. They label each section of the graph, and list the fractions from largest to smallest.
Curated OER
Count The Letters
Students perform activities involving ratios, proportions and percents. Given a newspaper article, groups of students count the number of letters in a given area. They use calculators and data collected to construct a pie chart and bar...
Curated OER
Spinning Probability
Sixth graders study the concept of probability. In this probability activity, 6th graders create spinners that match specific sets of clues. Students use their spinners and worksheets to explore and predict probability.
Curated OER
Finding the Area Under A Curve with Random Probability
Students explore the concept of area under a curve. In this area under a curve lesson, students find the area under a curve using the Monte Carlo method using random points and probability. Students calculate the area under the same...
Curated OER
SAT Problem Solving Practice Test
For this problem solving practice test, students select the best answer from 4 choices to ten questions. Questions are word problems and cover a variety of topics.
Curated OER
SAT Grid Practice Test 12
For this SAT practice test, students solve various problems dealing with percent, area of polygons, rates, functions, and distance. This one page on-line worksheet contains ten multi-step problems.
Curated OER
Science Vocabulary
Students examine Science in present day life. In this oral communication lesson, students discuss and rank scientific events from least to most important. Students discuss their responses and why they are different....
Other
Percentage Fraction Decimal Grid
Divide a square or circle up into a number of parts. The slices or rectangles can be painted various colors and these colors then represented as either decimals, fractions or percentages.
Texas Instruments
Texas Instruments: Grandparents and Special Friends Day
This lesson was designed for our Grandparents and Special Friends day. It can be used for any visitation day, or an open house. The lesson is designed to review percent of a whole and the sector of the circle representing the percentage....
E-learning for Kids
E Learning for Kids: Math: Group of Pyramids: Fractions and Graphs
On this interactive website, students practice various math skills using a real-life scenario at the pyramids. Those skills include showing percentages as fractions and decimals and interpreting data in a sector graph.
Beacon Learning Center
Beacon Learning Center: Chances Are
Students explore the likelihood of events using circle graphs and percentages in this interactive web lesson.
Alabama Learning Exchange
Alex: Great Golly Graphs
This lesson plan asks learners to create a survey project including graphs, questions, tables, and data analysis. It gives an assessment and ideas for remediation and extension as well as ways to manage behavior problems and reluctant...
Texas Instruments
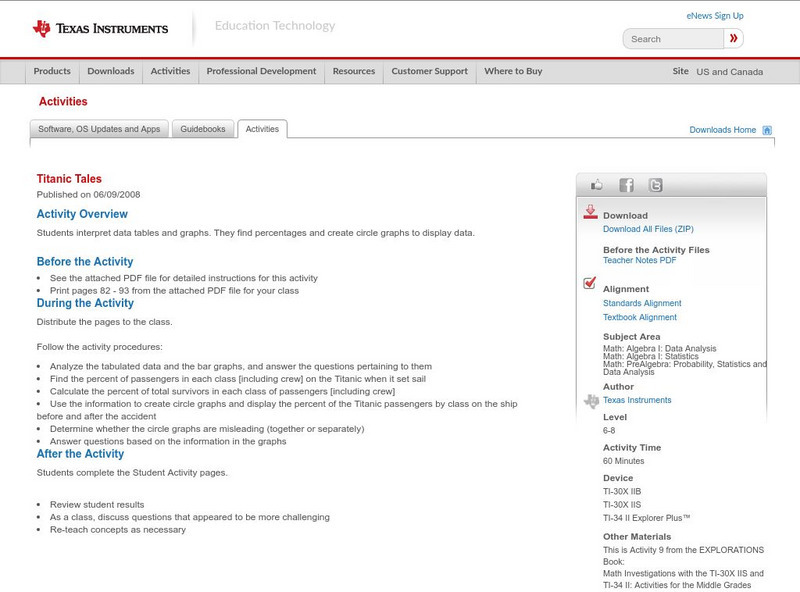
Texas Instruments: Titanic Tales
In this activity, students interpret data tables and graphs. They find percentages, and create circle graphs to display data.


