Curated OER
Likely Outcomes
A coin toss is a simple and fun way to help youngsters discovery probability. Preferably in partners, they first predict what would happen if they tossed two coins 48 times. How often would two heads show up? Two tails? How about one of...
Curated OER
Coin Tossing and Graphing
Fifth graders use technology as assistance to collecting random data. Through the random data they will be able to explain the significance of getting a head or tail depending on what was previously landed on. They will then analyze the...
Curated OER
Probability
Here is a classic activity used to introduce your class to the concept of probability and data collection. They will roll one die 30 times, then record and discuss the results. Great introduction, but too shallow to be considered a...
Curated OER
Chances And Tallying
In this graphing worksheet, 2nd graders use tally marks for a coin toss. Students respond to 5 questions about their chart and outcomes.
Curated OER
The Two Coin Problem
In this math instructional activity, students look for the answers to the 17 applications of looking at the outcomes of flipping two coins. They also graph the results.
Houghton Mifflin Harcourt
Unit 3 Math Vocabulary Cards (Grade 3)
Looking for math vocabulary cards for third graders? Use a set of 15 math cards with terms associated with graphing. The top half of each sheet has the vocabulary word printed in bold text, and the bottom half includes the word's...
Curated OER
Probability
Students complete various activities for probability. In this probability lesson plan, students use coins, cubes, peanut butter and jelly, playing cards, number cubes, darts, and a Gauss Curve to study probability. Students must orally...
Curated OER
Which Bag is Which?
Students explore number sense by completing a statistical analysis game in class. In this data graphing lesson, students utilize visual references such as colored cubes and tiles to map out the results of an experiment outcome such as a...
Curated OER
Heads-Up Probability
Second graders use tree diagrams to predict the possible outcomes of coin tosses. The data they collect and graph also help them predict the likelihood of getting heads or tails when tossing coins the next time.
Curated OER
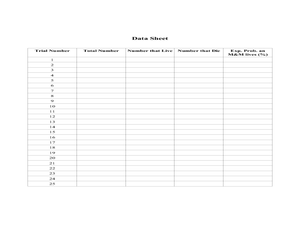
RIP M&M's
Learners solve theoretical probability problems. In this algebra lesson, students apply the concept of probabilities to solving real life scenarios. They collect data and graph it using experimental probability.
Curated OER
Tree Diagrams
For this tree diagrams worksheet, students solve and complete 10 different problems that include creating tree diagrams. First, they toss a coin and roll a die simultaneously to determine the outcomes with a tree diagram. Then, students...
Curated OER
Probability
Fourth graders perform probability experiments. In this math lesson plan, 4th graders complete a penny toss to evaluate and graph the combinations of outcomes. In a second activity, students draw M&Ms out of a bag and graph results....
Curated OER
Probability
Students investigate probability. In this fourth through sixth grade mathematics lesson, students collect, organize and display data in an appropriate chart or graph as they calculate and apply basic probability.
Curated OER
Rolling Dice
Fourth graders investigate the mathematical concept of probability. They determine the given mean of a data set found when rolling dice. The results of the experiment are displayed using a bar graph. The teacher does an example before...
Curated OER
Probability Popsicle Pop-ups
Fourth graders decorate and use popsicle sticks as manipulatives to assist with their learning of probability. They utilize a worksheet imbedded in this plan to organize the results of their experiment. They make a stem and leaf plot...
Curated OER
Fahrenheit Follies
Second graders analyze the effects of sunlight on a glass of water by using the thermometer to measure its temperature. They predict and measure the difference between water outside in the sun and shade and inside. They role-play a game...
Curated OER
Arthropod Data Collection
Young scholars describe the life cycle of various bugs as well as their predators and feeding habits. The class participates in a discussion of the various methods scientists use to gather data including research and experiment. After...
Curated OER
Cloud Watchers
Second graders read "The Cloud Book" by Tomie dePaola to jumpstart their cloud study. They offer examples of liquids, solids, and gases and chart them. They observe the making of a cloud in a demonstration. They discuss and draw...
Curated OER
Population Study and Applications Using PTC Paper
Students study human population traits. In this science lesson plan, students gain an understanding of the terms dominant, recessive, haploid (monoploid), diploid, genotype, phenotype, scientific sampling, and scientific modeling as they...
Curated OER
Sensational Seasons
Second graders explore how seasonal weather patterns affect temperature and their lives.
Curated OER
Heads & Tails Data Collection
In this data collection worksheet, students use a penny and a dime to play a math game. Students flip the money in the cup and then record the number of heads and tails showing marking the coins in the box.
Curated OER
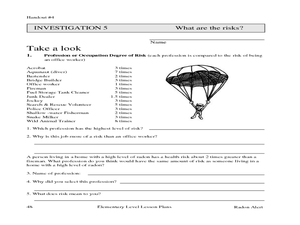
Radon Alert: Understanding Odds
In this radon alert: understanding odds worksheet, 5th graders predict results of rolling dice and record data in a chart, then compare odds of events and occupations, then compare that with radon exposure.
Curated OER
We Are Having a Party! Part II
Second graders, in groups, participate in a four-station rotation model to solve problems. They use coins and dice for stations one, two, and three.


