University of Waterloo (Canada)
Wired Math: Organizing Data Grade 7 [Pdf]
A collection of worksheets that focus on data analysis and organizing data. Includes detailed examples, colorful visuals, and a link to a related game. Acrobat Reader required.
Texas Education Agency
Texas Gateway: Scientific Investigation and Reasoning Data Organization
Using interactive exercises, students will review how to construct tables and graphs in order to organize data.
TED Talks
Ted: Ted Ed: David Mc Candless: The Beauty of Data Visualization
Listen and watch as David McCandless turns complex data sets into beautiful, simple diagrams. He suggests that information design is really important because we all like to visualize our information. [18:19]
Other
Nearpod: Introduction to Data Representation
In this lesson on representation data, young scholars explore how to make dot plots, histograms, and box plots and learn about outliers in a data set.
Yale University
Yale University: Categorical Data Examples
Site provides some different examples of categorical data and discusses the use of two-way tables.
National Council of Teachers of Mathematics
The Math Forum: Seventh Grade Mathematics: Data Sense
This site has some interesting ways to collect and evaluate data. There are some activities about note taking, spreadsheets, surveys, and a cool bridge construction project. Teachers may want to use this site as a resource for some...
Sophia Learning
Sophia: Continuous Data Tutorial
Continuous data is defined and explained in this video.
Sophia Learning
Sophia: Continuous Data
Continuous data is defined and examples are given in this lesson.
Sophia Learning
Sophia: Discrete Data
Explore the term discrete data and look at examples for further explanation.
National Council of Teachers of Mathematics
The Math Forum: Data Collecting Project Stats Class
This lesson plan provides the teacher with all the necessary handouts and directions to give a statistics class when they are ready to complete a thorough survey project. Broken into five parts, it takes the students through the...
Mangahigh
Mangahigh: Data: Questionnaires
Students learn about the concept of collecting data using questionnaires by exploring a tutorial. They can then test their knowledge by taking a ten question assessment that increases in difficulty as they correctly answer questions.
Other
Brebeuf Jesuit Preparatory School: The Scientific Method (Part 3) [Pdf]
Explains how to collect and organize data for an experiment. Describes how to make a table and graph the data, and when to use different types of graphs. Next, it discusses which variable should be on the x- or y-axis of a graph, and how...
Oswego City School District
Regents Exam Prep Center: Categorizing Data
Three lessons on different types of data (qualitative, quantitative, univariate, bivariate, biased data) as well as a practice activity and teacher resource.
Oswego City School District
Regents Exam Prep Center: Practice With Organizing and Interpreting Data
Several problems are presented to test your skills in creating and interpreting frequency tables, pie charts, box-and-whisker and stem-and-leaf plots.
CK-12 Foundation
Ck 12: Analyzing Data
[Free Registration/Login may be required to access all resource tools.] Students will learn how to choose a type of data visualization based on the kind of data they have collected and the objective of their research.
ClassFlow
Class Flow: Collecting and Analyzing Data Using Pedometers
[Free Registration/Login Required] Students will collect and analyze data after wearing a pedometer. They will record data, make a personal bar graph and a class graph. Activotes are used to analyze and discuss the data.
Texas Instruments
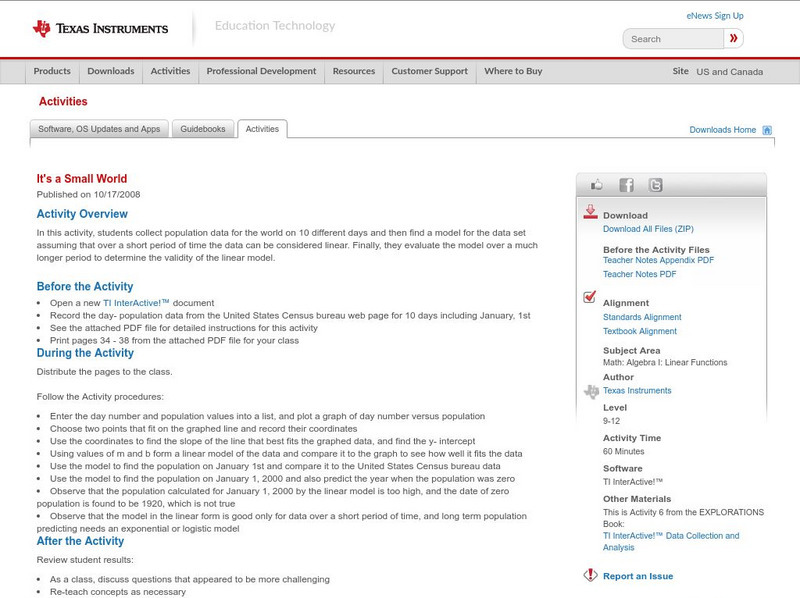
Texas Instruments: It's a Small World
In this activity, students collect population data for the world on 10 different days and then find a model for the data set assuming that over a short period of time the data can be considered linear. Finally, they evaluate the model...
Better Lesson
Better Lesson: Graphing Our Snack Mix: Review of Graphing
Second graders review how to make bar graphs, line plots, and pictographs by tallying the contents of snack mix and building graphs to show their data.
Better Lesson
Better Lesson: Graph Party
First graders will be involved in creating three different types of graphs and then be asked to answer questions about each representations data set.
National Council of Teachers of Mathematics
The Math Forum: A Collection of Secondary Math Units
Teachers of grades 9-12 can explore these seven math units for their classes. Data collection and analysis, problem solving with spreadsheets, and linear transformation are just a few of the topics covered here.
Texas Instruments
Texas Instruments: Solving a System of Linear Equations
In this activity, students' will collect and analyze motion data in order to determine the solution to a linear system of equations. They graph two motions on a common axis and find their intersection.
CK-12 Foundation
Ck 12: Statistics: Displaying by Type of Data Grade 7
[Free Registration/Login may be required to access all resource tools.] Collect, organize and display data collected from real-world surveys.
Center for Innovation in Engineering and Science Education, Stevens Institute of Technology
Ciese: Collaborative Projects
Using a variety of science topics, these projects link your class with classes around the world in data collection and analysis. There are projects recommended for all grade levels. Begin dates and end dates are listed to help in...
Other
A River Runs Through It Learning Project
In this year long learning project integrating mathematics and science, students solve environmental problems using data collection and problem solving concepts. Designed for upper elementary gifted students. Interactive components and...
![Wired Math: Organizing Data Grade 7 [Pdf] Activity Wired Math: Organizing Data Grade 7 [Pdf] Activity](https://d15y2dacu3jp90.cloudfront.net/images/attachment_defaults/resource/large/FPO-knovation.png)


