Vision Learning
Visionlearning: Data: Using Graphs and Visual Data in Science
An explanation of how data can be turned into visual forms which can help people comprehend information easier than observing numbers.
Other
Kindergarten lessons.com: Graphing Activities
Graphing activities for preschool and kindergarten include collecting data and organizing it in a variety of ways. There are lots of fun things to do in this area of math and the activities integrate well with science and literacy...
PBS
Pbs Kids Afterschool Adventure!: Operation: All About Us Activity Plan
It's time to stand in the spotlight! During this Afterschool Adventure, children will learn about and practice a variety of math skills as they gather information about their favorite subject-themselves! Children will start out by...
BSCS Science Learning
Bscs: Invitations to Inquiry With Data Using Field Scope
Invitations to Inquiry are short instructional activities designed to help middle and high school students work with large data sets. Teachers and students use the interactive FieldScope platform to collect, visualize, and analyze...
Cuemath
Cuemath: Frequency Distribution Table
A comprehensive guide for learning all about frequency distribution tables with definitions, how to create a frequency distribution table, and the formulas and graphs related to frequency distributions. With solved examples and...
EL Education
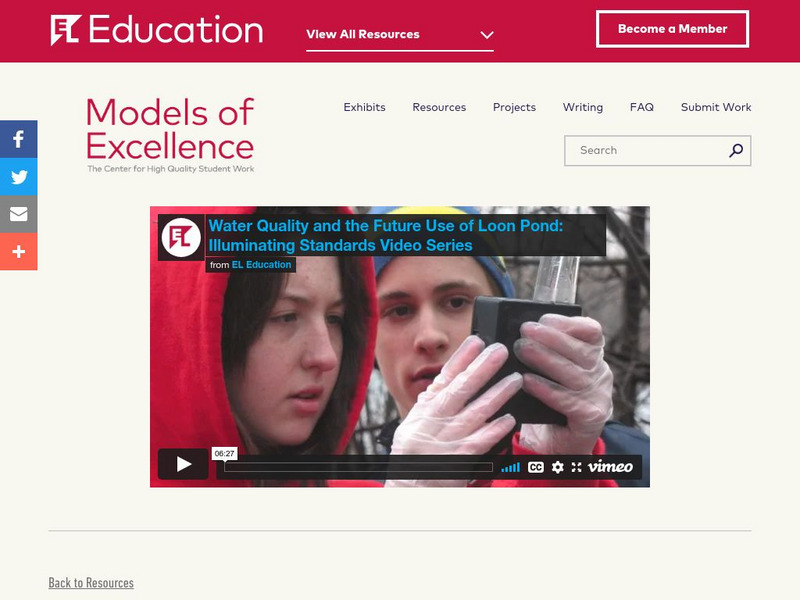
El Education: "Water Quality and Future Use of Loon Pond"
An online research report entitled "2007 Report on Water Quality and Future Use of Loon Pond" by ninth grade students from Renaissance Charter School in Springfield, Massachusetts. Students completed field work testing water and applied...
NASA
Nasa: Sea Surface Temperature Trends of the Gulf Stream
Students investigate changes in the surface temperatures of the Gulf Stream over the course of the seasons using data collected by NASA's satellites. The data is inputted into a spreadsheet and graphed.
American Museum of Natural History
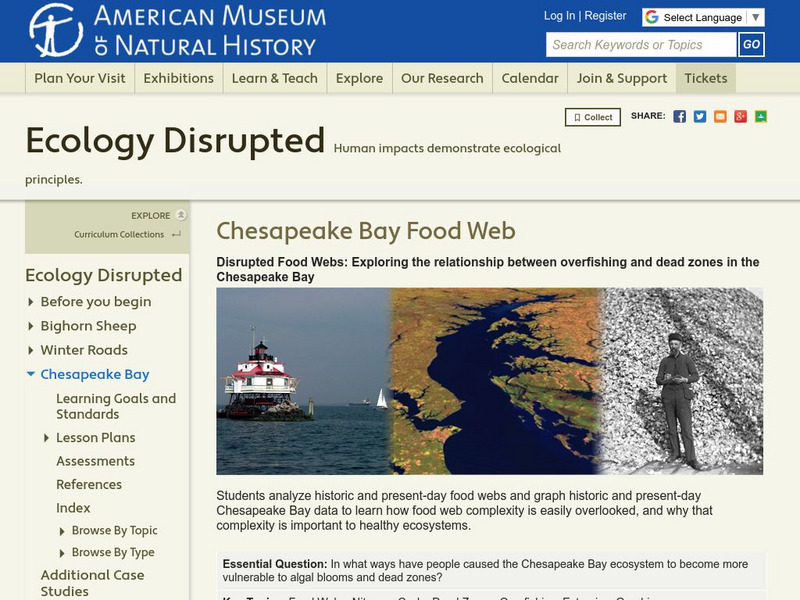
American Museum of Natural History: Ecology Disrupted: Chesapeake Bay Food Web
In this comprehensive lesson unit, students examine how overfishing has affected Chesapeake Bay's ecosystem. They will study food webs from the past and present and graph related data.
BioEd Online
Bio Ed Online: Balloon Blast
In the following lesson students are asked to devise a plan to measure the distance of a balloon's flight, predict the direction a balloon will travel as it deflates, learn about Newton's Laws of Motion, experience Newton's Third Law,...
PBS
Pbs Kids Afterschool Adventure!: Operation: Martha's Stem Stories Activity Plan
Welcome to Martha's STEM Stories! STEM stands for science, technology, engineering, and mathematics. You may already know that doing STEM means testing ideas, collecting data, making calculations, and drawing graphs and charts-but you...
National Council of Teachers of Mathematics
Nctm: Illuminations: State Names
Students use multiple representations to display how many times the letters of the alphabet is used in a state name. Concepts explored: stem and leaf, box and whisker plots, histograms.
Texas Instruments
Texas Instruments: Discovering Ohm's Law
In this activity, students use voltage and current probes to investigate Ohm's Law. The students collect data and use their graphing calculators to perform data analysis and "discover" Ohm's Law.
University of Arizona
Cell Biology: Online Onion Root Tips
Online mitosis activity offers the student the opportunity to identify, classify, calculate, and graph the phases of mitosis. Explanations of each phase, actual cells are displayed for classifying and gathering data in this comprehensive...


