Curated OER
Closing the Case
Fifth graders collect data and prepare data displays using a survey with statistical information.
Curated OER
What's The Teacher's Choice?
Fifth graders explore how to use data and display it using a chart or graph. They use food choices for categories and then gather the data and use the provided chart for display. In small groups students discuss the data and the results.
Curated OER
Central Tendencies and Normal Distribution Curve
Fourth graders are given data (class test scores) to determine central tendencies, and find information needed to construct a normal distribution curve. They become proficient in calculating mode, median and average.
Curated OER
Iron For Breakfast
Third graders are challenged to use scientific thinking, they experiment and observe which objects are attracted to a magnet. Pupils use the evidence to construct an explanation as to what common property the objects attracted to a...
Curated OER
Nutrition and Food Security
Examine the three basic nutrients and their effects on the body. Fifth graders will research data to construct a bar graph and then demonstrate the relationship between malnutrition and food security. This is a very comprehensive...
Curated OER
Oh, What A Day
Learners listen as the teacher reads A Country Far Away. They predict what they will do and what they think their partner student will be doing. Students create a KWL chart for Japan. They collect information about their activities on an...
Curated OER
Hot and Cold Colors
Students experiment with the color and solar energy absorption. In this color and solar energy absorption lesson plan, students spend two days discussing and experimenting with the concept of energy absorption. They paint cans with...
Illustrative Mathematics
How Many Buttons?
Bring the class into the probability by having everyone count buttons on their shirts. Organize the data into the chart provided and chose different possibilities such as "female with one button" or "all students with more than four...
Kenan Fellows
Using Water Chemistry as an Indicator of Stream Health
Will this water source support life? Small groups test the chemistry of the water drawn from two different sources. They then compare the collected data to acceptable levels to draw conclusions about the health of the source. The...
Curated OER
The Good and Bad Bacteria
Students are able to name one kind of harmful bacteria and why it hurts us and also name one kind of helpful bacteria and how we use it. They describe the process of growing bacterial cultures in a lab. Students create a reasonable...
Curated OER
The Game is Afoot - A Study of Sherlock Holmes
Mystery is an exciting genre for young readers to investigate. The plots are so intriguing! Here is a series of lessons featuring Sherlock Holmes stories that invite learners to enter the world of the mystery genre. Based on what...
Curated OER
Education for Global Peace
Fifth graders construct data graphs based upon sets of data. In this graphing lesson, 5th graders read the text If the World Were a Village and discuss how types of graphs accurately represent a large population. Students construct their...
Curated OER
And the Survey Says...
Students use technology to input, retrieve, organize, manipulate, evaluate, and communicate information; apply appropriate technologies to critical thinking, creative expression, and decision-making skills. They collect and explore data...
Curated OER
Mystery Graphs
Learners study graphs and learn how to display information into a graph. In this graph lesson plan, students construct a graph of their own sorted data, and pick out things in graphs that are inconsistent.
Curated OER
Sorting Sweethearts
Learners categorize sweetheart candy by color or message. In this sorting and graphing lesson, students collect data by sorting the candy and then diagram their results in a graph.
Curated OER
Energy Content of Foods
Learners collect data, organize and analyze the data and compare it to real life scenarios. This assignment requires two class periods.
Curated OER
Let's Get Physical
Learners collect data using the CBL. In this statistics instructional activity, students predict the type of graph that will be created based on the type of activity the person does. The graph represents heart rate depending the level of...
Curated OER
Baseball Stats
Students explore data sheets and statistics in baseball. They use baseball data available on the Internet to develop an understanding of the different ways in which data can be analyzed.
Curated OER
Investigation - How Tall is the Average Sixth Grader?
Pupils will measure each other and record the data in inches. They will use a stem and leaf plot to display data and figure out the average height of the students in a class. The other statistical data will be collected like the mode and...
Curated OER
The Great Turkey Walk
Young scholars formulate questions that can be addressed with data and collect, organize, and display relevant data to answer them. They wcreate bar graphs and pie graphs
American Statistical Association
How Tall and How Many?
Is there a relationship between height and the number of siblings? Classmates collect data on their heights and numbers of brothers and sisters. They apply statistical methods to determine if such a relationship exists.
Curated OER
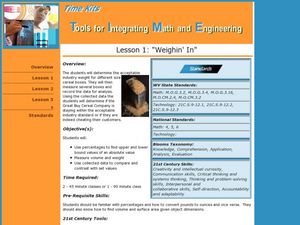
Tools for Integrating Math and Engineering: Weighin' In
Learners collect and analyze data on a fictional cereal company's products. In this measurement lesson, students collect data from cereal boxes (weight, volume, surface area, etc.) to determine if the boxes labels correctly inform...
Curated OER
Environmental Issues in Multimedia Presentation
Students investigate a community environmental issue. They document it using traditional scientific methods, digital photography, and videotaping. After collecting data, they graph the results. Students present their findings in a...
Curated OER
Microsoft Excel Lesson Plan
Fifth graders collect, organize, interpret data. In addition, they compare different textures, color including graphical representations such as bar graph, line graph .Students also describe the uses of rocks and how to use that to...


