Curated OER
Timed Multiplication Test Graphs
Learners use the tools of data analysis for managing information. They solve problems by generating, collecting, organizing, displaying histograms on bar graphs, circle graphs, line graphs, pictographs and charts. Students determine...
Curated OER
Exploring the Maryland State Archives Website
Student demonstrates the ability to organize, manage and comprehend information and applies appropriate skills to collect organize, and interpret data, They then explore an appreciation of media a sources of information and recreation.
Curated OER
Make Way for Ducklings
First graders use skills to collect, organize, and interpret data. They compare and contrast two stories, Make Way for Ducklings and Chibi: A True Story From Japan. Students create a duckling.
Curated OER
Rainforest Deforestation and the Water Cycle
Students create terrariums (mini rainforests). They observe and discuss the life processes that occur in their terrariums and how changes in these processes affect the plants and organisms inside. They collect and graph data and present...
Curated OER
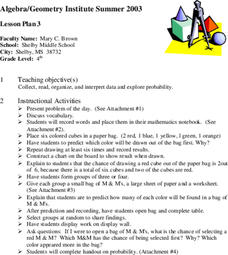
Exploring Probability
Fourth graders participate in a lesson that explores probability. They use candy and model cubes to experiment with different outcomes that can be charted if the students can proceed to the objective of the lesson. They discover how...
Curated OER
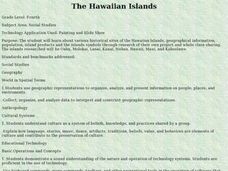
The Hawaiian Islands
Fourth graders present information of people, places, and environments. They collect, organize, and analyze date to use with these representations.
Curated OER
Keypals and You
Students collect and compare data received from keypals. They use electronic mail to exchange information with keypals and rrite a paper comparing similarities and differences between themselves and their keypals. In addition, use a...
Curated OER
Traveling with Flat Stanley
students use the internet to gather geographical data about a state of their choice. Using new vocabulary, they describe the features present in the state, its climate and attractions. They develop a PowerPoint presentation to share...
Curated OER
Harry Potter Research Project
Students work together to complete a research project on Harry Potter. They write a research question and develop a survey to give to their classmates. Using the results, they create a graph and draw conclusions about the data collected.
Curated OER
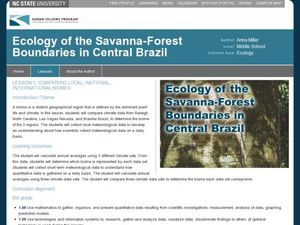
Comparing Local, National, International Biomes
Students calculate averages of climate sets of data. In this ecology lesson, students analyze data to determine identity of a biome and collect meteorological data to understand process. Students also compare data sets.
Curated OER
Box Plots
Students review the concept of median, explore how to calculate quartiles for any size data set and experience how to build a box plot.
Curated OER
Leaping Lemurs! How far can you jump?
Students watch a segment of the PBS video which show the lemurs' ability to jump. In pairs, students collect measurement data involving each other's length of a standard step, a standing broad jump, and a long jump. They record their...
Curated OER
Water - Planning for the Future
Students explore and examine the increases and/or decreases for water user groups: irrigation, municipal, manufacturing, steam electric power generation cooling, livestock, and mining. They utilize percentage changes during their...
Curated OER
Line of Best Fit
Learners explore the concept of linear regression. In this linear regression lesson, students do a Barbie bungee activity where they collect linear data. Learners plot their data using a scatter plot. Students determine a line of best...
Curated OER
Histograms and Bar Graphs
Learners are introduced to histograms, bar graphs, and the concept of class interval. They use an activity and three discussions with supplemental exercises to help students explore how data can be graphically represented (and...
Curated OER
Bar and Histograms (What Would You Use: Part 1)
Students practice creating bar graphs using a given set of data. Using the same data, they create a group frequency chart and histograms. They must decide the best graph for the given set of data. They share their graphs with the...
Curated OER
Sets an the Venn Diagram
Students explore the characteristics of sets and Venn Diagrams. Given data, students practice determining the placement of elements in a Venn Diagram. Students discuss the correspondence between data sets and their graphical...
Curated OER
Stem-and- Leaf Plots
Students are introduce to the notion of stem-and-leaf plots. They use stem-and-leaf plots to calculate the mean, median, and mode of a set of data. Students use computers to learn about stem-and-leaf plots.
Curated OER
Using Computers to Produce Spreadsheets and Bar Graphs
Students review graphing terminology and how to plot data points, how to input data into a spreadsheet, and how to make a chart using a computer.
Curated OER
Paper Parachutes
Students participate in a simulation of a parachute-jump competition by making paper parachutes and then dropping them towards a target on the floor. They measure the distance from the point where the paper parachute lands compared to...
Curated OER
Threads
Young scholars group observed data, filtering from all their observations the similarities between burring threads. In the second part they make a comparison of a chosen attribute between the two threads.
Curated OER
Weather Graphs
First graders use their knowledge of weather symbols to organize and construct a graph of the daily weather for one month. Each student have a chance to give the daily weather report using Sammy's Science House Computer Software.
Curated OER
More Jelly Bean Math
Students use their color categorized jelly beans to find the range, mean, median and mode. They use their recorded data documenting how many jelly beans there are for each color in order to calculate the range, mean, median and mode of...
Curated OER
Will There be Enough Water?
Students investigate water usage, water available, and water demand historically in the local area. They use projections of water usage, availability and demand up to the year 2050. Students use graphs to relate as well as compare and...


