Curated OER
Line & Scatter (What Would You Use: Part 2)
Young scholars discuss line graphs and scatter plots and the best situations in which to use them. Using the graphs, they determine the type of correlation between variables on a scatterplot. They create a scatterplot and line graph...
Curated OER
I'm a Weather Watcher Watching plants grow by......my,my,my
Young scholars investigate how weather affects how plants grow. They collect data on weather and plant growth for a week and display the data on a graph. For a culminating experience they design a movie using software that shows plant...
Curated OER
Graph a Panther's Diet
Students examine the diet of panthers. In this interpreting data lesson plan, students collect data on the panther's diet and chart the data in bar and pie graphs.
Curated OER
Transportation Through Time
Third graders measure the speed at which they can walk in order to understand speed and distance traveled. They then research the history of transportation and express data in a class timeline.
Curated OER
Water Regulation
High schoolers use their basic knowledge of physiology to analyze graphical data of paramecia under diverse conditions. From the data analysis, Students develop explanations of the animal's response to the concentration of different...
Curated OER
"Weather" or Not?
Students complete a three week unit about weather and how it affects our behavior. They read and discuss various books related to weather, conduct an experiment about the tilt of the earth, plan a field trip based on temperature,...
Discovery Education
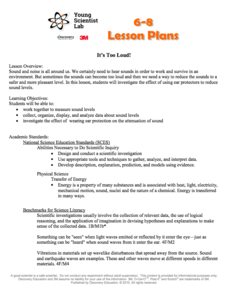
It's Too Loud!
STEM scholars investigate sound attenuation by conducting an experiment in which they compare the farthest distance that they can hear a sound with and without ear protection.
Curated OER
Estimation Task
Upper graders practice their estimation skills by observing different objects then making their best guess without using measuring instruments. Students are asked to estimate mass, length, volume, and area.
Curated OER
Investigating the Probability
Students investigate probability using coins and dice. They collect data, graph, organize and interpret data. They predict, describe, compare, compute and draw conclusions based on what they observe and record.
Curated OER
Design Patterns in Everyday Life
Students find symbols and patterns in everyday life. In this patterns lesson, students break into groups and look for specific patterns and symbols. Students record their findings. Students create a graphic organizer with the information.
Curated OER
Testing the Waters
Eleventh graders examine a local body of water. In this science lesson, 11th graders collect water samples to test. Students analyze the data and make conclusions. Students create tables and graphs of the data.
Curated OER
Critter Museum
Learners act as directors of a new science museum where they have decided to set up a display of animals without backbones that are found in the area. To organize their display, they need to sort and classify a collection of animals and...
Curated OER
Electric Circuits
Students determine the power dissipated in the combination of two resistors connected in series to a 6 volt battery. This task assesses students' abilities to develop procedures for an investigation, develop a plan for recording and...
Curated OER
Snell's Law
Learners determine whether the index of refraction of sample of Corn Syrup meets Federal standards. This task assess students' abilities to explain the procedures for investigation, plan for recording and organizing observations and...
Curated OER
What's Your Line?
Fifth graders collect temperature readings over a period of time, enter the information into a spreadsheet and choose the appropriate graph to display the results.
Curated OER
Grade 2: Spinning Sums
Second graders collect data by spinning two spinners and creating sums, organize the data, and make conclusions from the data. Each students makes a spinner. They spin and record the number of the section each time. Students work in...
Curated OER
Party, Party, Party
Second graders conduct investigations with counting, comparing, organizing, analyzing, displaying and interpreting data. They pose questions for investigation and collect the data. Students display the data in tally charts, uniform...
Curated OER
Super Spreadsheets
Young scholars discover information about each of the fifty states in the United States. In groups, they create a spreadsheet organizing the information to show to the class. They discover different ways to display the data and...
Curated OER
Weather the Storm
Fourth graders complete multi-curricular activities for weather. In this weather lesson, 4th graders complete creative writing, research, and weather data analysis activities for the lesson.
Curated OER
Box-and-Whisker
Seventh graders are introduced to the concept of box-and-whisker plots. A step-by-step process for creating a box-and-whisker plot is provided. The goal of the instructional activity is that students study the components of a...
Curated OER
Let the Sunshine in
Students collect and analyze data to study wavelengths of visible light. They cover Styrofoam cups with three different colors of sun filtering products and shine a lamp directly on the cups. They determine the most effective filtering...
Curated OER
BioKeys
Young scholars identify insect (and plant) specimens using the online resource Biokeys. They record the data that they collect in their notebooks. Students use identification characteristics and features that are shared and unique...
Curated OER
Geometric Relatioships
Students explore measurements and geometric formulas. In this geometry lesson, students investigate pi as it relates to geometry. They collect data and use a chart to organize the data.
Curated OER
Population Density
Learners use the scientific method to conduct an experiment and use varied methods to gather background information. They correctly use lab equipment and prepare tables and graphs that organize, conclude, and present their findings. ...


